
This post is an introduction to Polygon Research’s interactive dashboard – CPSVision – along with some examples of how it can be used.
The Census Bureau’s Current Population Survey (CPS) dates back to the 1930’s when it set out – with the Bureau of Labor Statistics – to calculate the US unemployment rate. Over these decades, the Census Bureau honed its survey skills, laying the foundation for its launch of the larger American Community Survey (ACS) in 2005 (see Polygon Research’s CensusVision).
The CPS program also includes annual supplemental surveys – most notably the Annual Social and Economic Supplement (ASEC), which is conducted in and around March each year. With the most recent ASEC currently available we can see how the pandemic has affected various population and household trends in the United States, including multiple aspects of migration:
- How many people moved?
- Where did they move from?
- Where did they move to?
- Why did they move?
Since Polygon Research’s apps ingest and model microdata, they we can see the intersection of all these questions, and gain deeper insights into these migration factors.
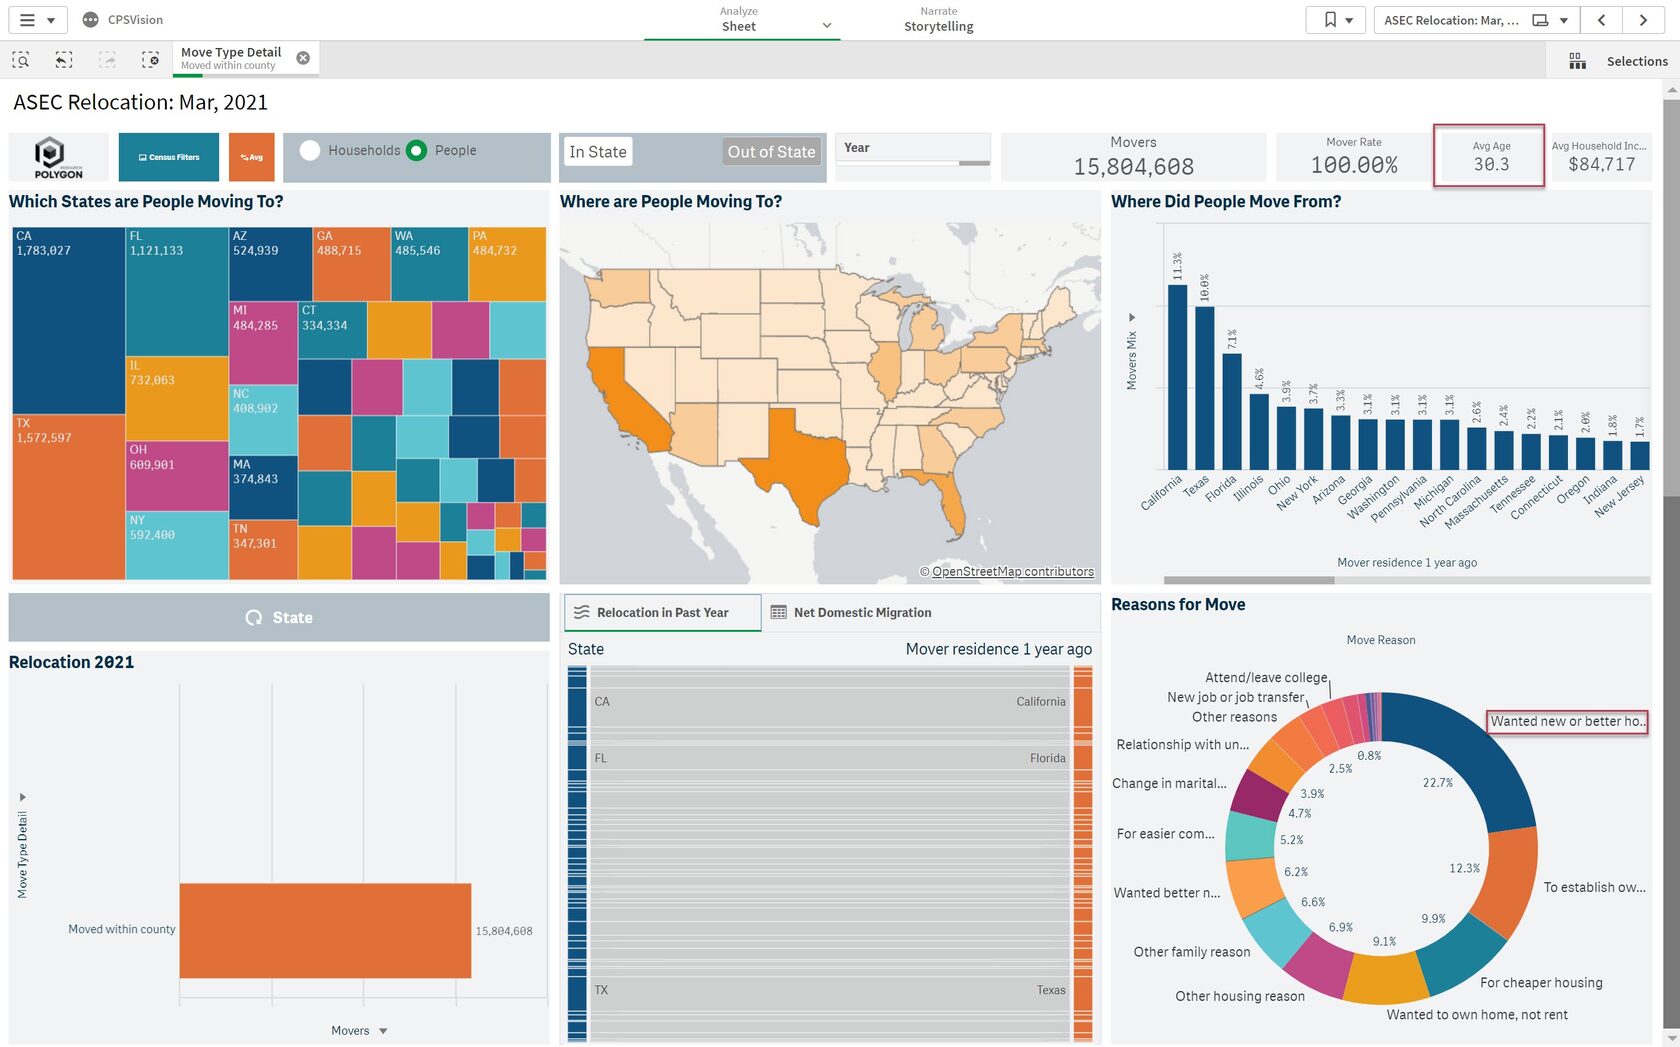
For example, when someone moves within the same county, why do they do so? According to the most recent ASEC release, 22.7% of people who moved within the same county in the past year did so because they wanted new or better housing (see figure 1 below).
Fig. 1: CPSVision - Relocation analysis of movers within a county
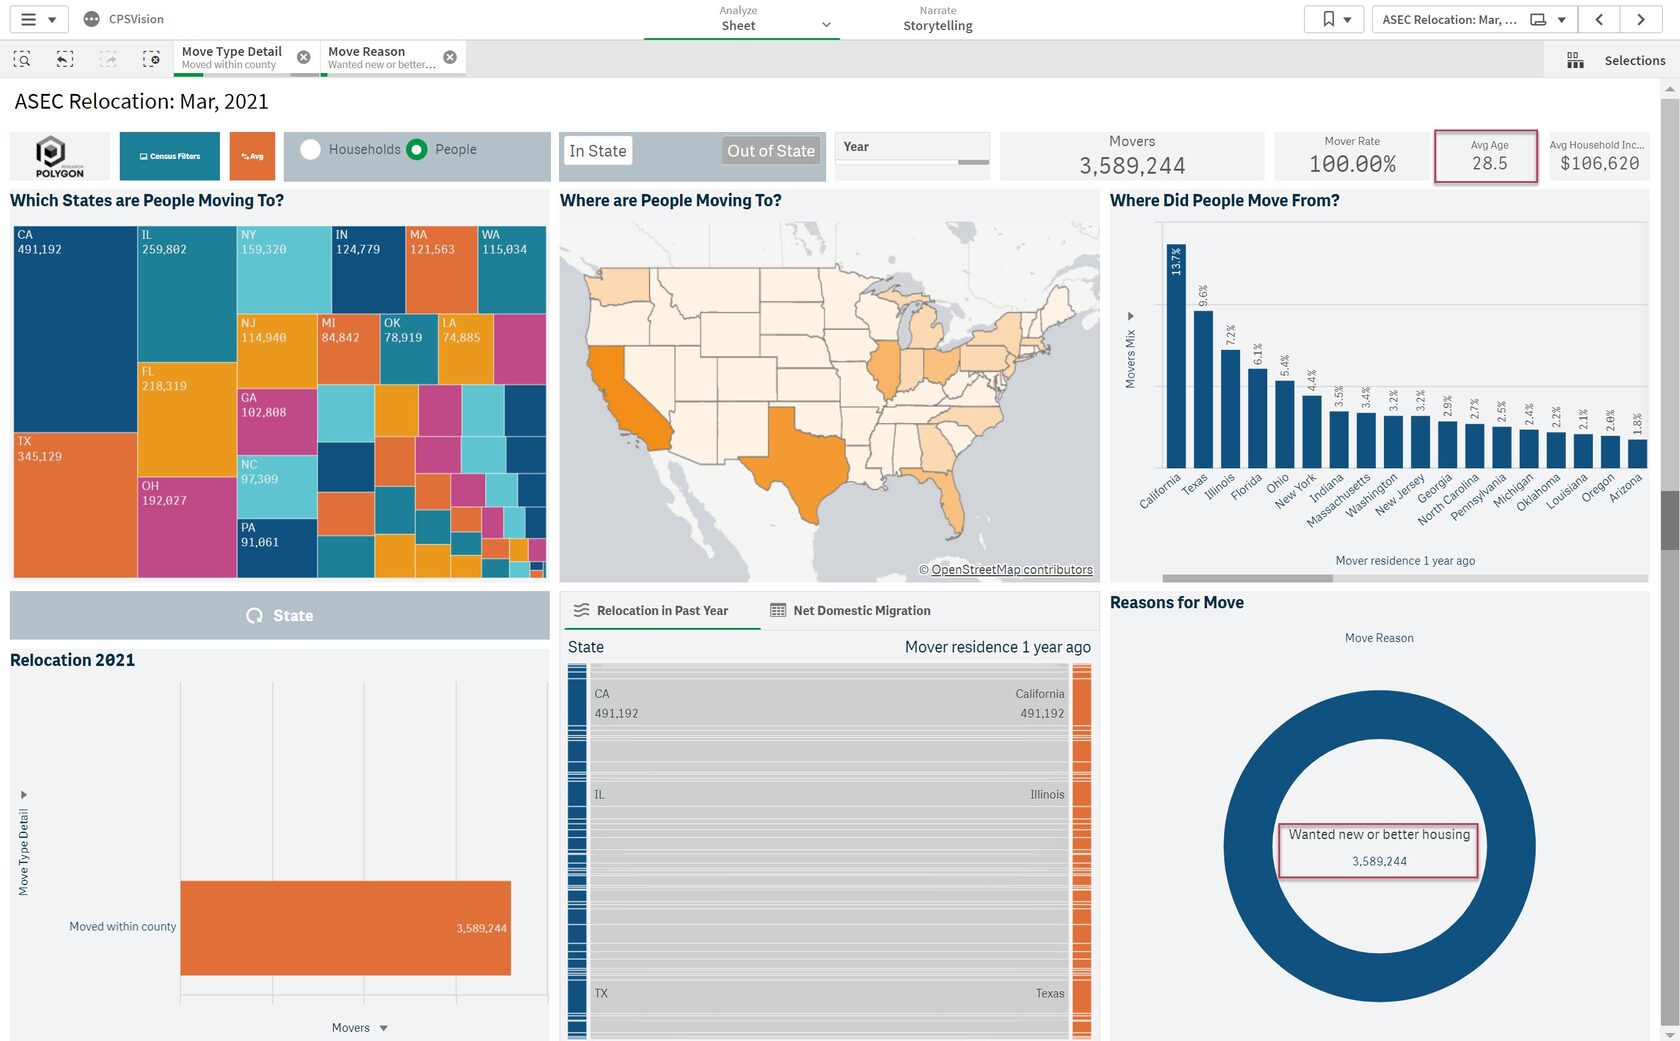
Broken down further, most people moving within county for new or better housing do so in California, followed by Texas, with Illinois in third. This is expected as these are some of the largest states by population. Adjusting for state populations, we can observe who has the highest rate of this sort of move. After this adjustment, the states with the highest rate of people moving within county for new or better housing are Delaware, Illinois, and Oklahoma.
CPSVision also allows for insight on demographic factors within this selection. For example, people making this sort of move are also younger on average: the average age of a mover documented in the ASEC is 30.9, and the average age of someone moving within county for new/better housing is 28.5 (figure 2 below), while the average age of all people in the US is 39.2.
Figure 2: CPSVision - Movers who moved for better housing within a county
This is the sort of storytelling Polygon Research apps allow for. While the summarized data released by the US Census can be easily combed over for many trends, Polygon allows for deeper insights into the data and gives the users flexibility to answer questions about these trends. With the extensive filters available, users can define specific groups for analysis that would be impossible to identify only using only the summarized data.