
Lenders today are more data-driven than ever, and yet many of these lenders' marketing, sales, product, compliance, HR, and operations teams aren't leveraging the full value in the available mortgage market data - derived from the lender reporting submitted under HMDA - for data-driven strategies.
Leveraging HDMA data for finding lending niches
HMDA modified LAR data which is released each spring (by the CFPB) is big and complex, and in order to get the full value of it, lenders have to use data science models and tools to ingest and model the data sets over multiple years. We used HMDAVision, our best-in-class web-based mortgage market intel app, to crunch the 2018-2021 HMDA LAR data, and will share some of these insights here. We focused on the niche of financing investment properties first because of its significant size, and second because of the growth rate that this segment has experienced over the last four years.
But before we dive into this mortgage lending market segment, let's step back and see the big picture using another of our apps, CensusVision (with 5 years of ACS 1R PUMS data and 4 years of CPS monthly and ASEC data). There are over 44.4 Million households in the US who live in rental units (our analysis of 2021 ASEC data in CensusVision).
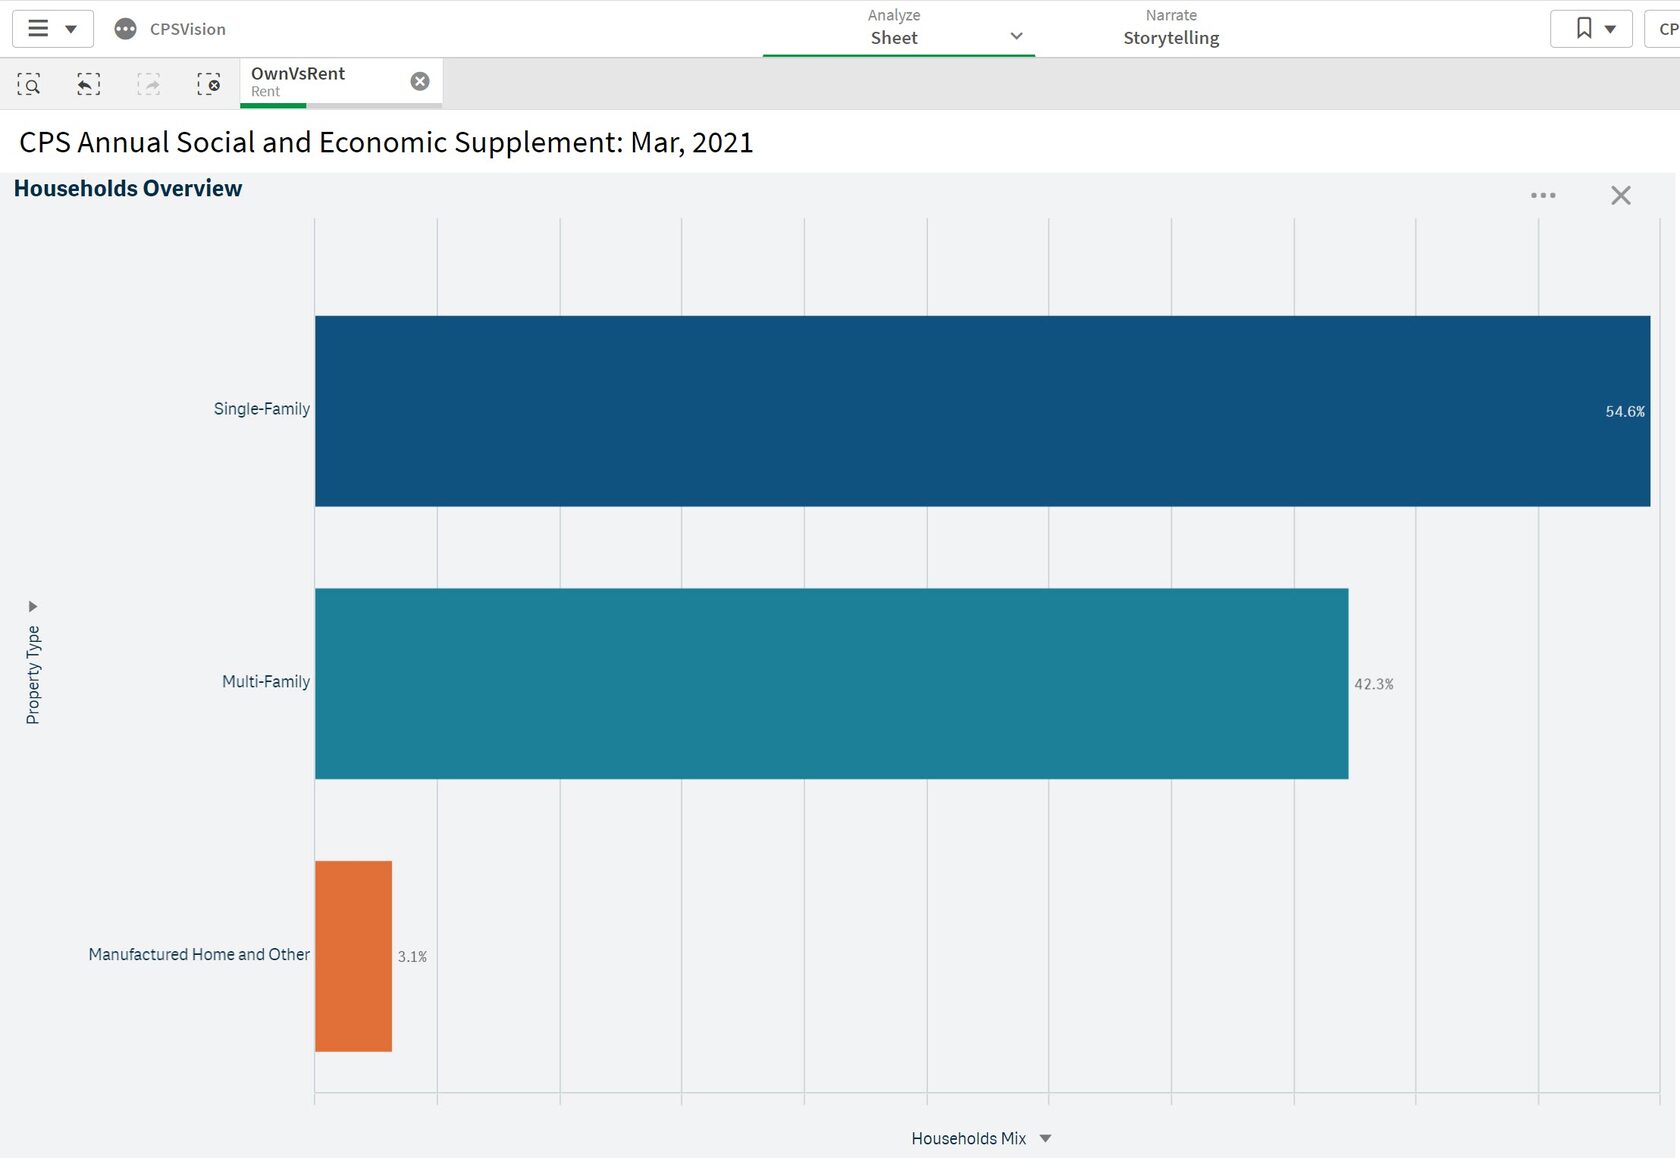
As shown above, 54.6% of renter households rented single-family units (defined as 1-4). That means that there are over 24 million 1-4 units owned by landlords, which are either individuals or small mom and pop operations. Lending to this segment - i.e. for the purchase or refinance or home improvement of an investment property - is important to wealth creation and to continuing to provide affordable housing alternatives.
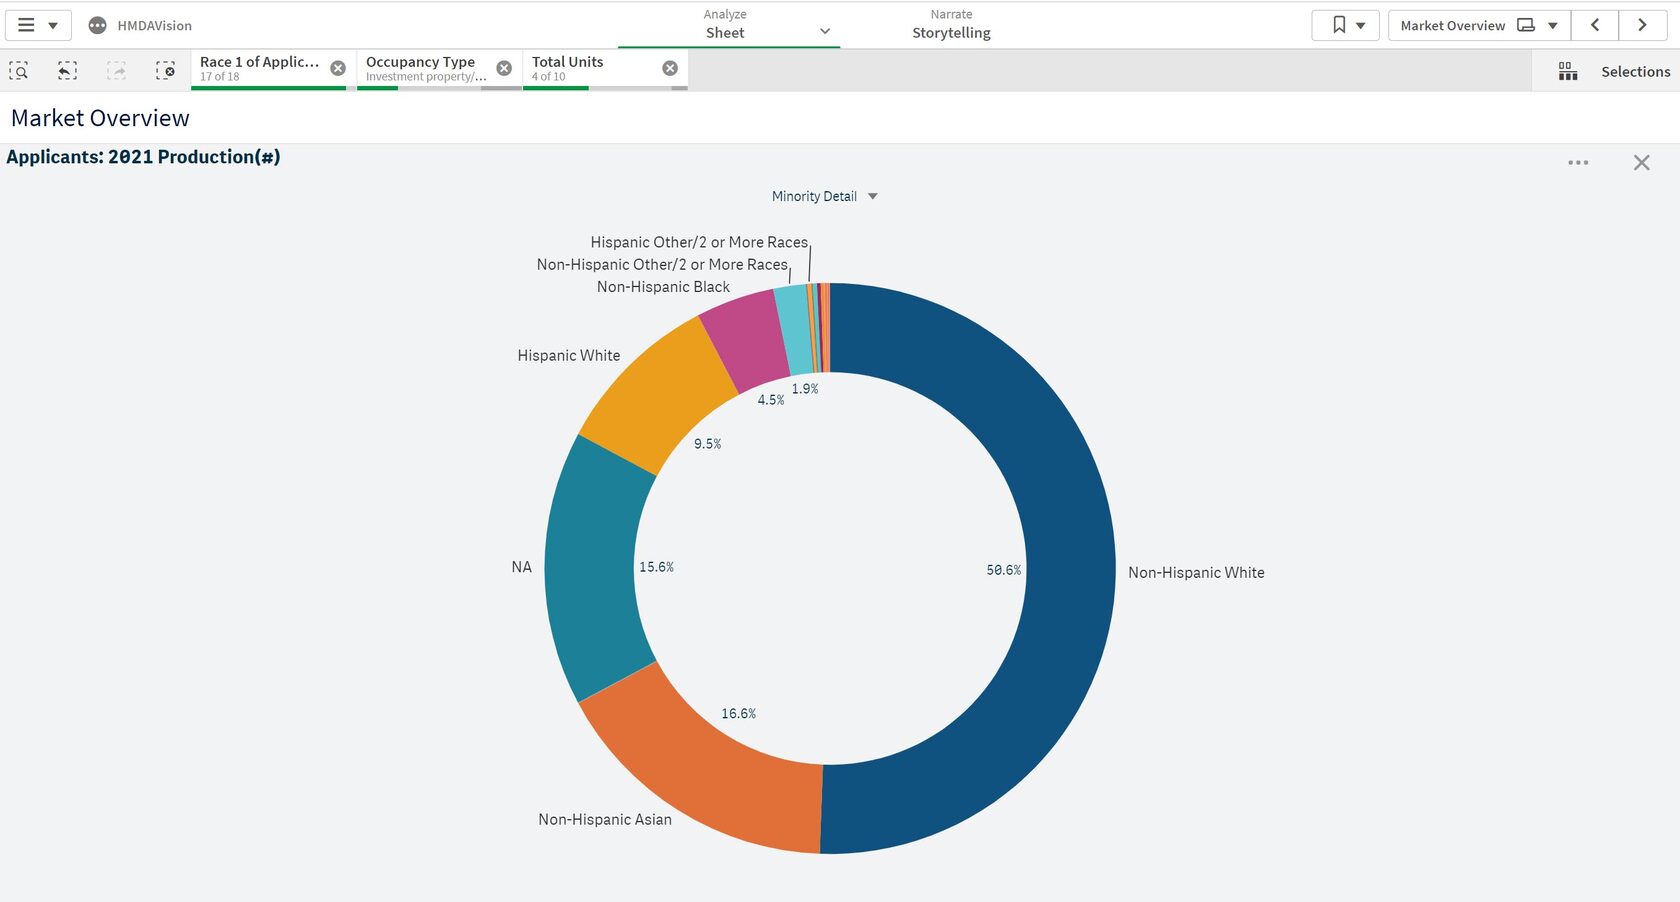
With this baseline, we turned to HMDAVision for mortgage lending insights. Of course, we do not have the cash purchase data in HMDAVision to determine the actual share of institutional investors, but as far as investors are using mortgages to finance the purchase or refinance of an investment property, we estimate that about 16% of these mortgages were made to institutional investors, and the rest to individuals. Below is our estimate of the demographic distribution of the investment loans (excluding those 16% we estimate were made to institutional investors):
2021 Investment Loan Production and Trends
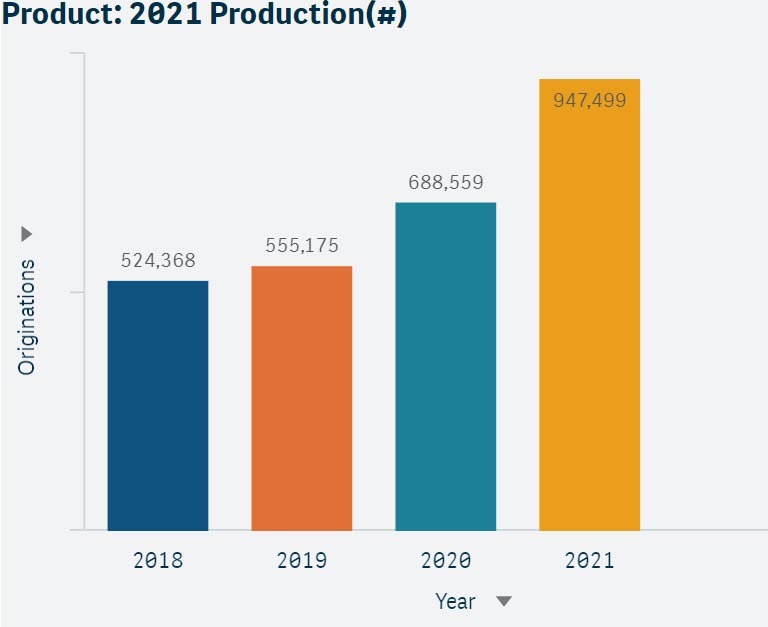
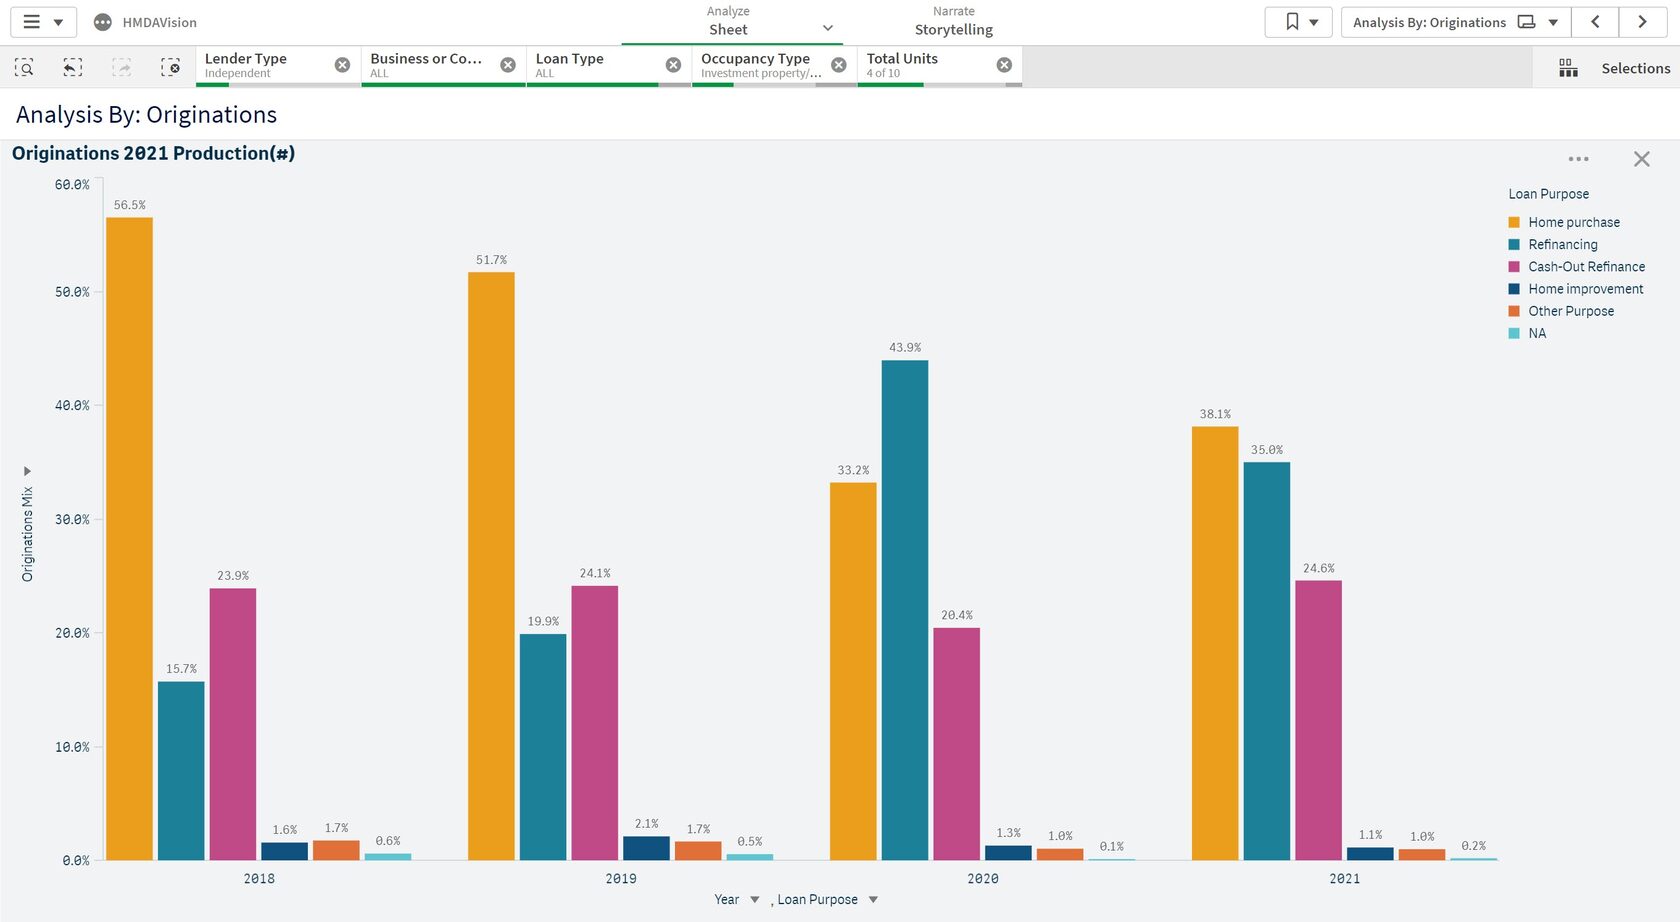
The mortgage loan production collateralized with 1-4 unit investment properties approached 1 million loans, and at $263 Billion, surpassed the quarter-of-a-trillion mark in 2021. As shown below, mortgage transactions collateralized with 1-4 units increased 1.8x times from 2018 to 2021, growing at a steady rate of 21-22% per year.
As in every other aspect of mortgage lending, independent mortgage lenders advanced in the investment property market and took market share from the banks. This mortgage lending strategy shift started in 2020 and continued in 2021.
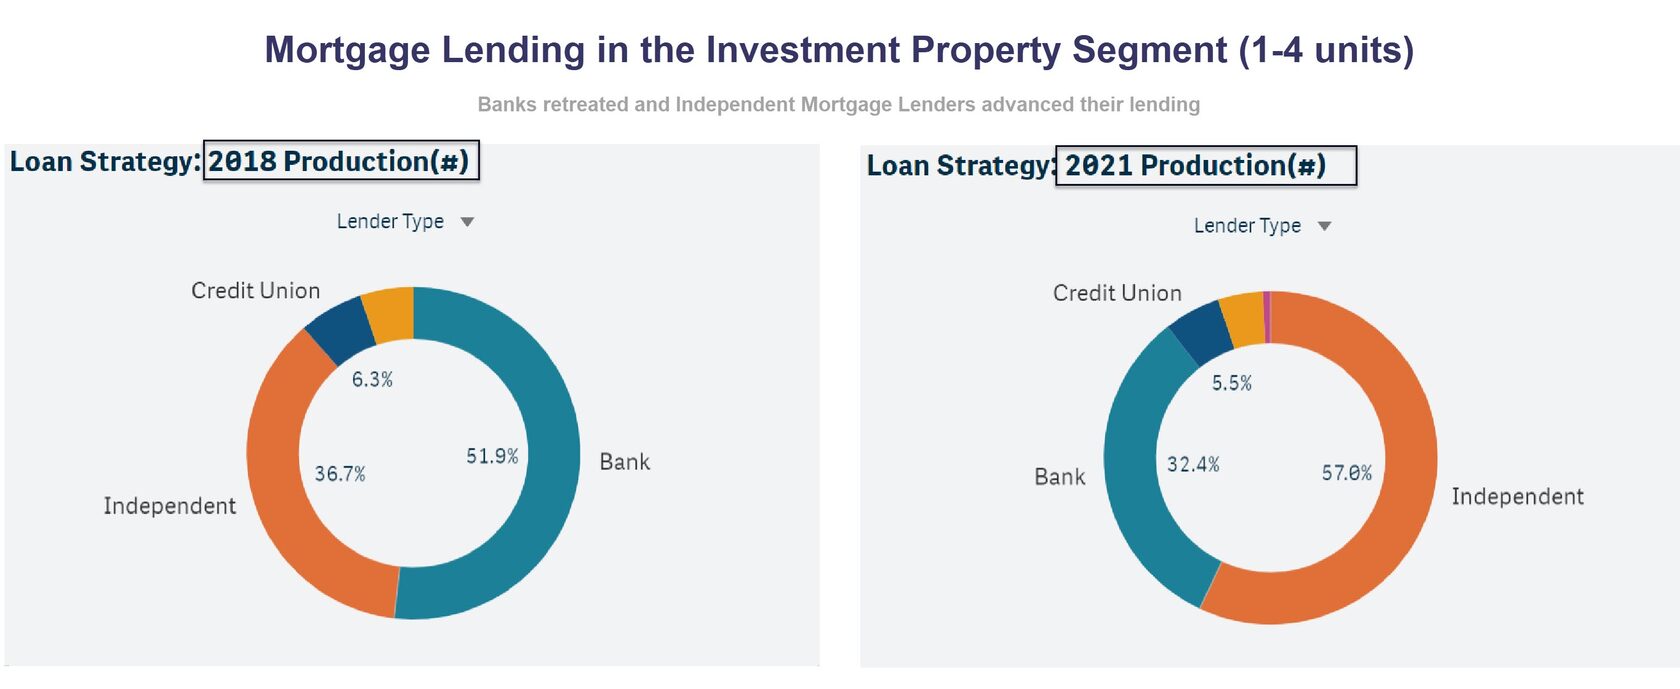
Banks continued to lend in this segment at 4.1% CAGR since 2018, while independent mortgage lenders accelerated their investment property lending 10x faster than the banks (41% CAGR). The independent mortgage lenders found growth in the refinance and cash-out refinance opportunities available in 2020 and 2021.
While these are useful national insights, the action happens in local real estate and mortgage markets. Understanding these trends in your own market territory (or assessment area, for banks), is crucial for designing a winning competitive strategy in a niche market.
HMDAVision is helpful in exploring every aspect of the investment property mortgage market. The questions that lenders can answer are:
What are the geo locations (MSA, county, zip codes and census tracts) in my market that have the biggest concentration of investment loans?
What are the characteristics of these locations? For example, what percent of originations are flowing to LMI areas, vs. middle-income, vs. upper-income areas?
Which of these locations are growing the fastest? And why? What is driving this growth? Are most of the investors institutional or are they mostly individuals/families?
Who are the biggest competitors? How are they competing - product? channel? other?
Where is the liquidity in this market? Are the agencies actively providing liquidity for 1-4 unit investment properties? Are the banks buying such loans?
What are the product features of investment products in my market? How are my products standing out in comparison to my competitors'? Am I taking full advantage of my strengths in various segments, like purchase or cash-out refinance?
These are some of the questions that can be asked and answered with HMDA insights. Schedule 15 minutes with us to continue this conversation in HMDAVision.