
In the mortgage banking industry, the concept of fair lending is pivotal, and so is the analysis that ensures it. Traditionally tethered to the notion of statistical significance, fair lending analysis has undergone a seismic shift with the advent of more comprehensive loan-level data combined and cloud-scale analytics. Our blog begins with the premise that with the richness of loan-level detail provided by the Home Mortgage Disclosure Act (HMDA) Loan Application Register (LAR), traditional notions of significance give way to more concrete, immediate realities.
With the comprehensive HMDA LAR dataset, we're not peeking through a keyhole but observing the entire landscape. In this full view, the traditional tentpoles of statistical significance give way to a more nuanced appreciation of disparities.
Statistical Significance is A Sample-Sized Viewpoint
What is statistical significance and why are we talking about it? Statistical significance exits in a world of samples. It answers the question: "Could this pattern in our sample be due to chance?", or, put differently: "Would we see the same pattern in another sample (and another)?" It's a crucial concept when you're extrapolating insights from a subset to a wider population. However, HMDA data doesn't deal in samples; it presents the entirety of loan application data for reporting lenders, rendering moot the question of whether your slice of loans is representative of the whole. HMDA LAR data isn't a slice of reality; it's the whole pie. That is, if your analytics platform is up to the task.
What is Population-level in the HMDA LAR context?
Population-level in the context of HMDA LAR data analysis aligns with the concept of "loan-level" microdata. This data isn't a mere segment or a snapshot; it's a complete dataset encompassing every loan application, leaving no story untold. In this context, each individual loan application acts as a unique data point, allowing us to conduct what we refer to as population-level analysis. This level of granularity in analysis enables a meticulous examination of lending practices and outcomes, affording us insights that could otherwise be obscured in sample-based analytics.
Measuring Disparity Now and Then
Disparity in fair lending refers to the differences in lending outcomes across various demographic groups that should not exist based on creditworthiness alone. These disparities can manifest in approval rates, loan pricing, and which products lenders are offering. Traditionally, identifying these disparities involved statistical tests on samples of data, seeking to discern if observed differences were due to random variation or a sign of underlying bias.
Historically, analysts would draw samples from the larger population of loan applications and apply statistical methods to estimate whether observed differences—like a lower approval rate for a minority group—were statistically significant. This approach, while valuable, was inherently limited by the fact that a sample might not fully represent the entire population.
The advent of loan-level microdata and cloud-scale computing has revolutionized this process. Now, we assess every loan application, which means we observe the actual gaps in lending outcomes, not estimates. This enables a direct measure of the disparities without resorting to inference or the concept of statistical significance.
The advent of loan-level microdata and cloud-scale computing has revolutionized this process. Now, we assess every loan application, which means we observe the actual gaps in lending outcomes, not estimates. This enables a direct measure of the disparities without resorting to inference or the concept of statistical significance.
A New Frontier in Fair Lending Analysis
To work with the HMDA LAR the modern way, you need to be able to access the entire loan-level HMDA LAR, modeled and blended with FFIEC demographics and housing data. HMDAVision® stands at the forefront of this new capability, allowing you to consistently and accurately analyze ~100 million rows of loan-level data in-memory, interactively. By transparently measuring actual gaps as disparity indices, HMDAVision facilitates comprehensive analyses across critical aspects of lending:
Redlining Analysis
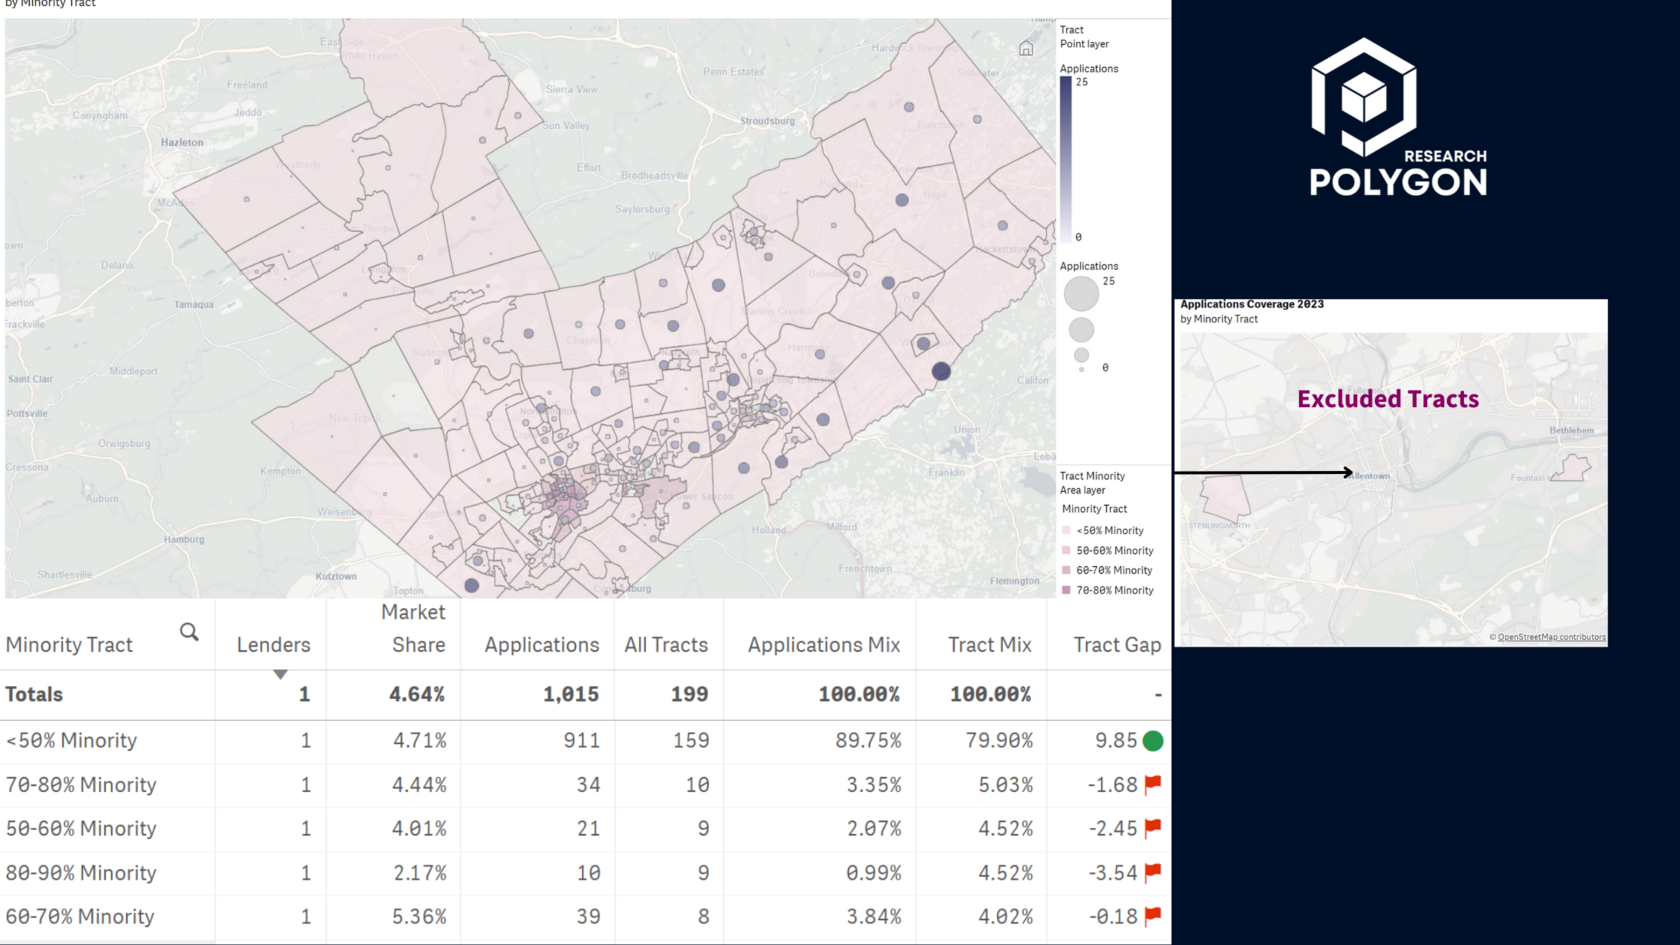
To determine the presence or appearance of redlining, we analyze the HMDA LAR loan level data to determine whether lenders provide services in balance across different neighborhoods regardless of racial or ethnic compositions. Freed from the constraints of statistical significance, our focus shifts to practical significance—the true impact of lending practices on communities. With HMDAVision, we're not constrained to hypotheses and probabilities; instead, we reveal the actual lending landscape with pinpoint accuracy. This granular approach lays bare the realities of neighborhood lending disparities, empowering stakeholders to take decisive, informed action rooted in the tangible evidence of comprehensive data.
Marketing Analysis
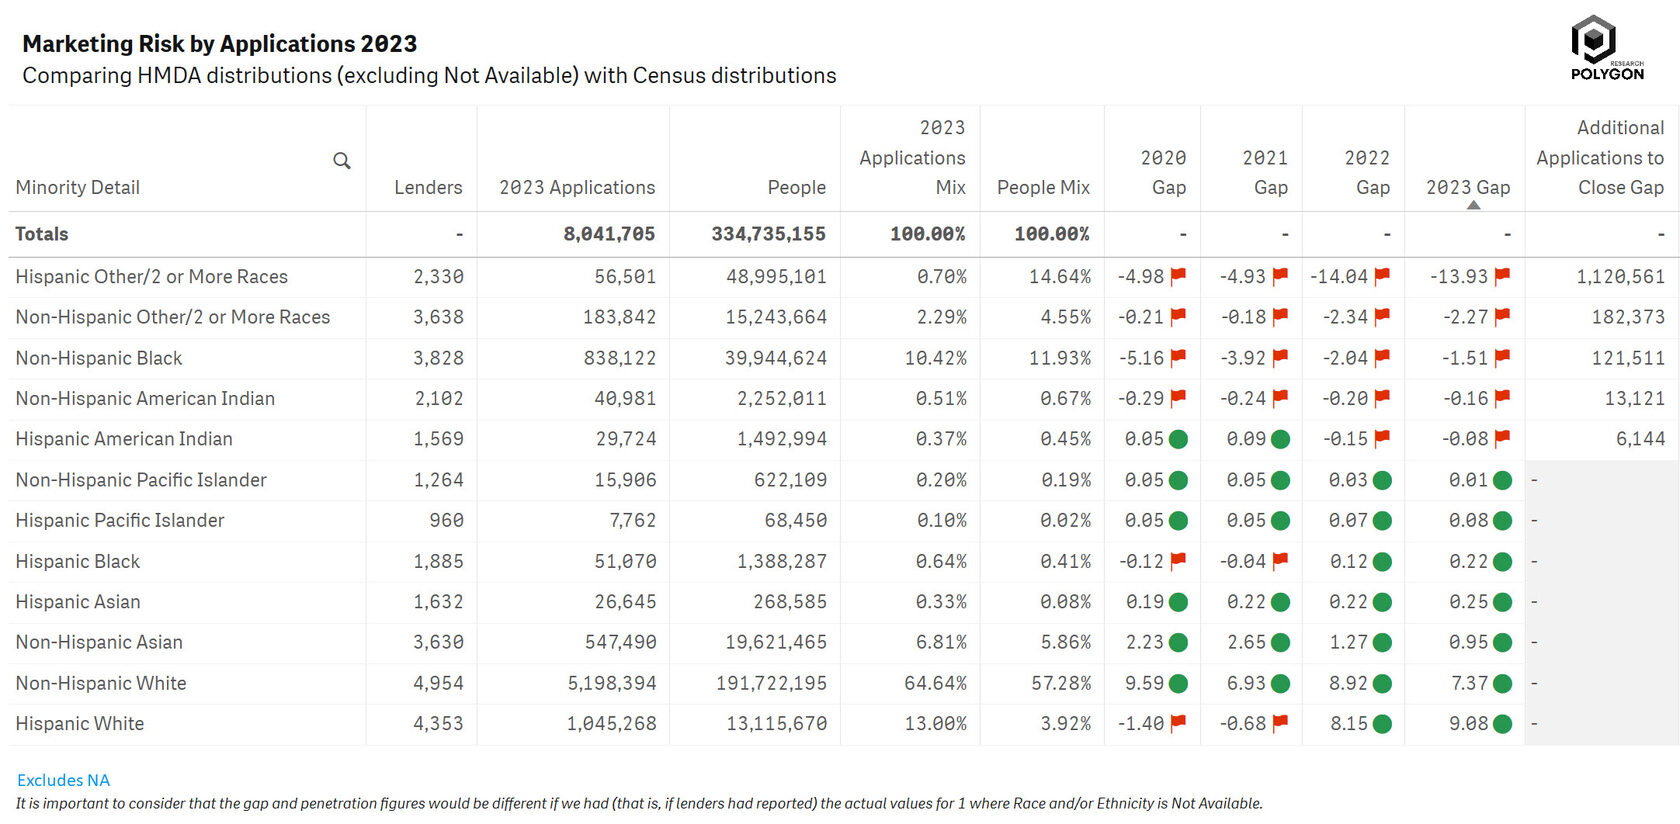
Marketing analysis aims to assess the reach and impact of lenders' marketing efforts to ensure all demographic groups have equal awareness of available loan products.
With HMDAVision, the focus shifts from abstract statistical significance to the tangible realities of marketing gaps and disparities as revealed by loan-level and demographics data. HMDAVision helps lenders understand the reach—or lack thereof—of their marketing efforts across diverse demographics.
By juxtaposing the proportion of loan applications from various minority groups against their representation in the population, you can draw a picture of where marketing may be falling short. This isn't about whether disparities are statistically significant but whether they are practically significant—do lenders effectively reach all segments of the market? This is also an action-oriented analysis - pointing to the number of applications needed to close the gap, instantly giving marketers an estimate of the market size.
The snapshot above reflects the entire U.S. marketplace, but in HMDAVision you can select one lender at a time (or a group of lenders) at any geographic level to perform this analysis. The platform also allows users to monitor trends over time, providing insight into whether marketing disparities are widening, narrowing, or remaining constant.
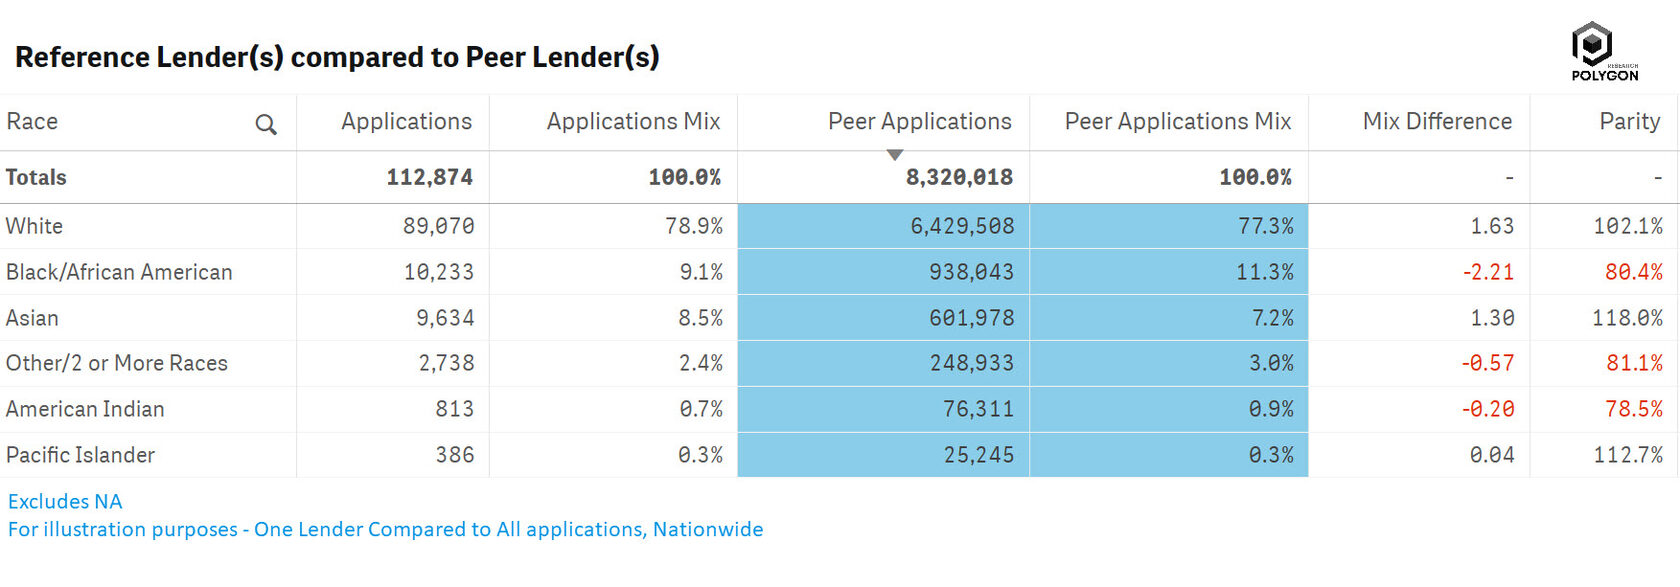
But it is not enough just to measure the results of marketing activities (i.e. number of applications) to the population mix. You have to compare your lending performance to that of peers and the market in order to understand if your performance is off or in line with the market or peer performance. In the context of fair lending, such clear-cut evidence holds more weight than statistical tests because it directly reflects the real-world impact of a lender’s policies and practices. This shift from inferential statistics to direct measurement aligns perfectly with the move towards more proactive, data-driven decision-making in the industry.
Underwriting Analysis
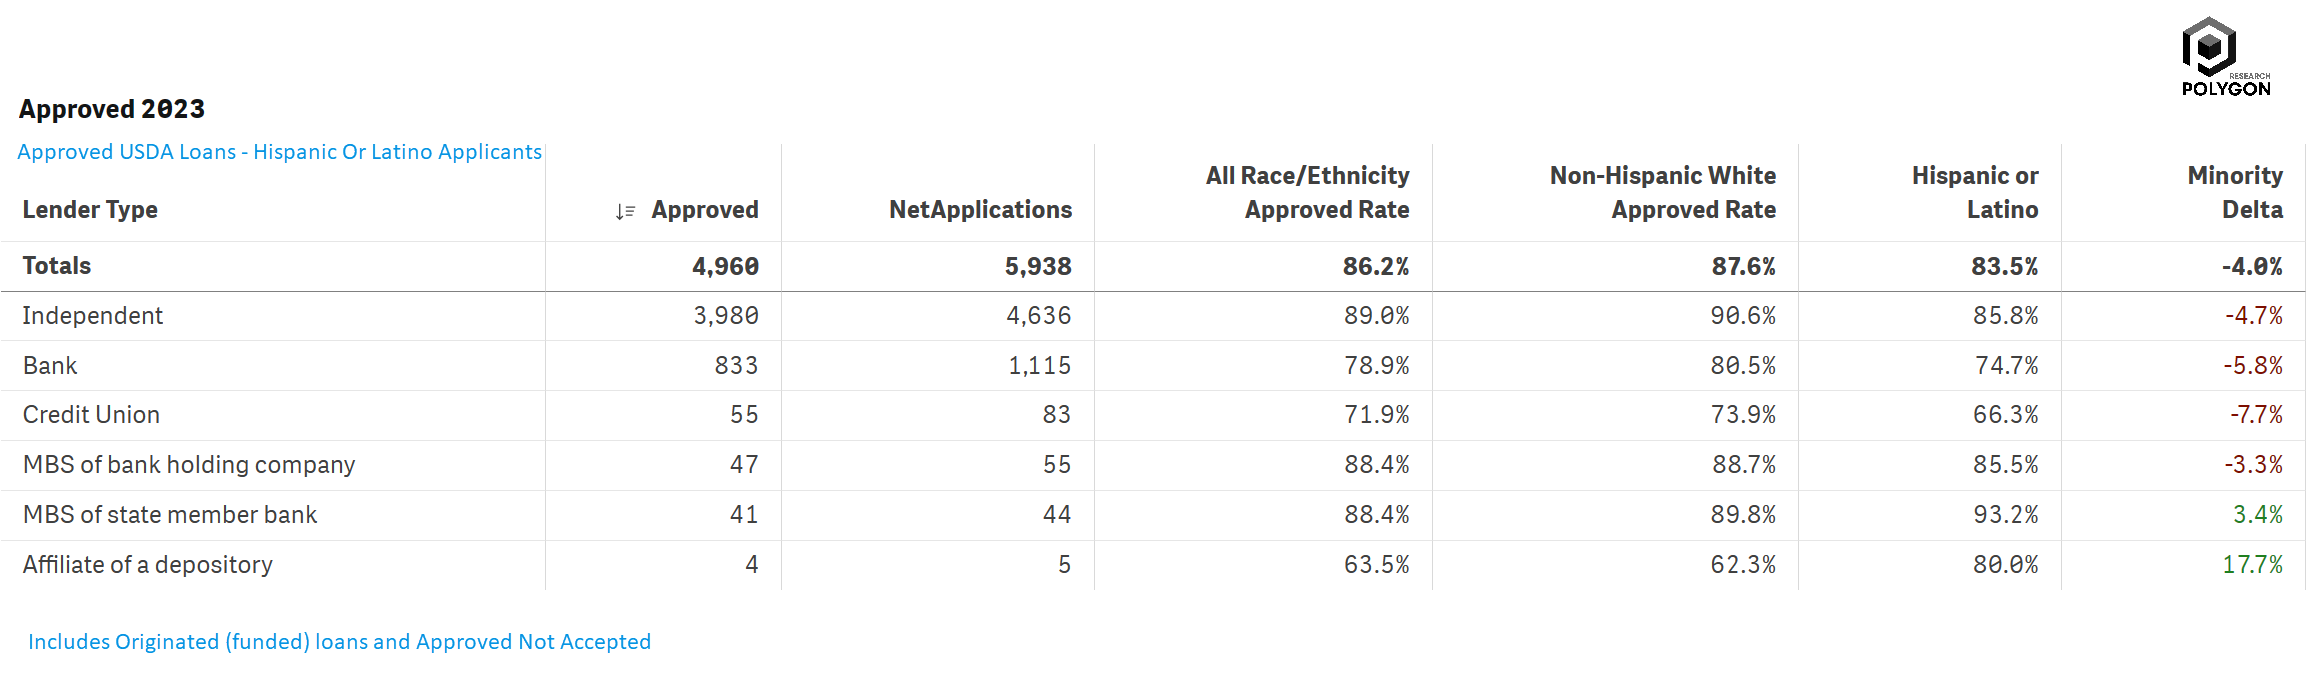
The starting point for underwriting analysis often is marginal effects analysis between protected class and non-protected class applicants, like the one shown in the table above for USDA loans to Hispanic applicants. During an analysis of underwriting, the focus is on the decision-making process and the terms of loans to uncover any discrepancies that cannot be justified by financial criteria alone. For example, incorporating filters like CLTV and DTI, income, property value, and loan features, HMDAVision allows users to incorporate credit policy thresholds from to measure impact on protected classes in terms of outcomes such as approval and denial rates, withdrawn/incomplete, and more.
Pricing

With the expanded HMDA data first published in 2018, HMDAVision directly calculates disparities in prices, including interest rates, fees, points, discount points, and closing costs. This allows for the comparison of prices offered to different demographic groups (across race, ethnicity, sex, and age) to identify potential discrimination. For example, the table above measures the difference in prices for a specific segment - Loans with CLTV 80% to 85%, DTI 30%<36%, Conventional, Home Purchase, Closed-end, First Lien, 1-4 units, site-built properties.
Higher Priced Loans (HPL)
A loan is considered higher-priced if the APR is a certain percentage above the APOR:
- For first-lien, owner-occupied, conventional loans, if the APR is 1.5 percentage points or more above the APOR.
- For first-lien, owner-occupied, government-backed loans, if the APR is 1.5 percentage points or more above the APOR.
- For junior-lien loans, if the APR is 3.5 percentage points or more above the APOR.
- For first-lien, owner-occupied, jumbo loans (loans exceeding the size limit eligible for purchase by Freddie Mac or Fannie Mae), if the APR is 2.5 percentage points or more above the APOR.
We provide an example of HPL analysis in the Steering seciton.
Steering
In steering analysis, we use the available loan-level HMDA data to ensure that borrowers, especially those from protected class groups, are not disproportionately directed towards higher priced loans, certain types of loan products or loans with unfavorable terms. When we analyze fair lending using the entire loan-level dataset, we capture a universe of transactions that tell us directly about the lending patterns without the veil of probability and margins of error. This holistic view presents an opportunity to shift our focus from statistical significance to practical significance emphasizing the real-world implications of lending practices.
Let's observe the chart below with 2023 purchase mortgage originations in Jefferson County, NY. When looking at the distribution of loans by sex and loan type, we find that there are no glaring disparities in loan products offered to male and female applicants. This finding holds even when examining additional context like median applicant income and loan size.
Let's observe the chart below with 2023 purchase mortgage originations in Jefferson County, NY. When looking at the distribution of loans by sex and loan type, we find that there are no glaring disparities in loan products offered to male and female applicants. This finding holds even when examining additional context like median applicant income and loan size.
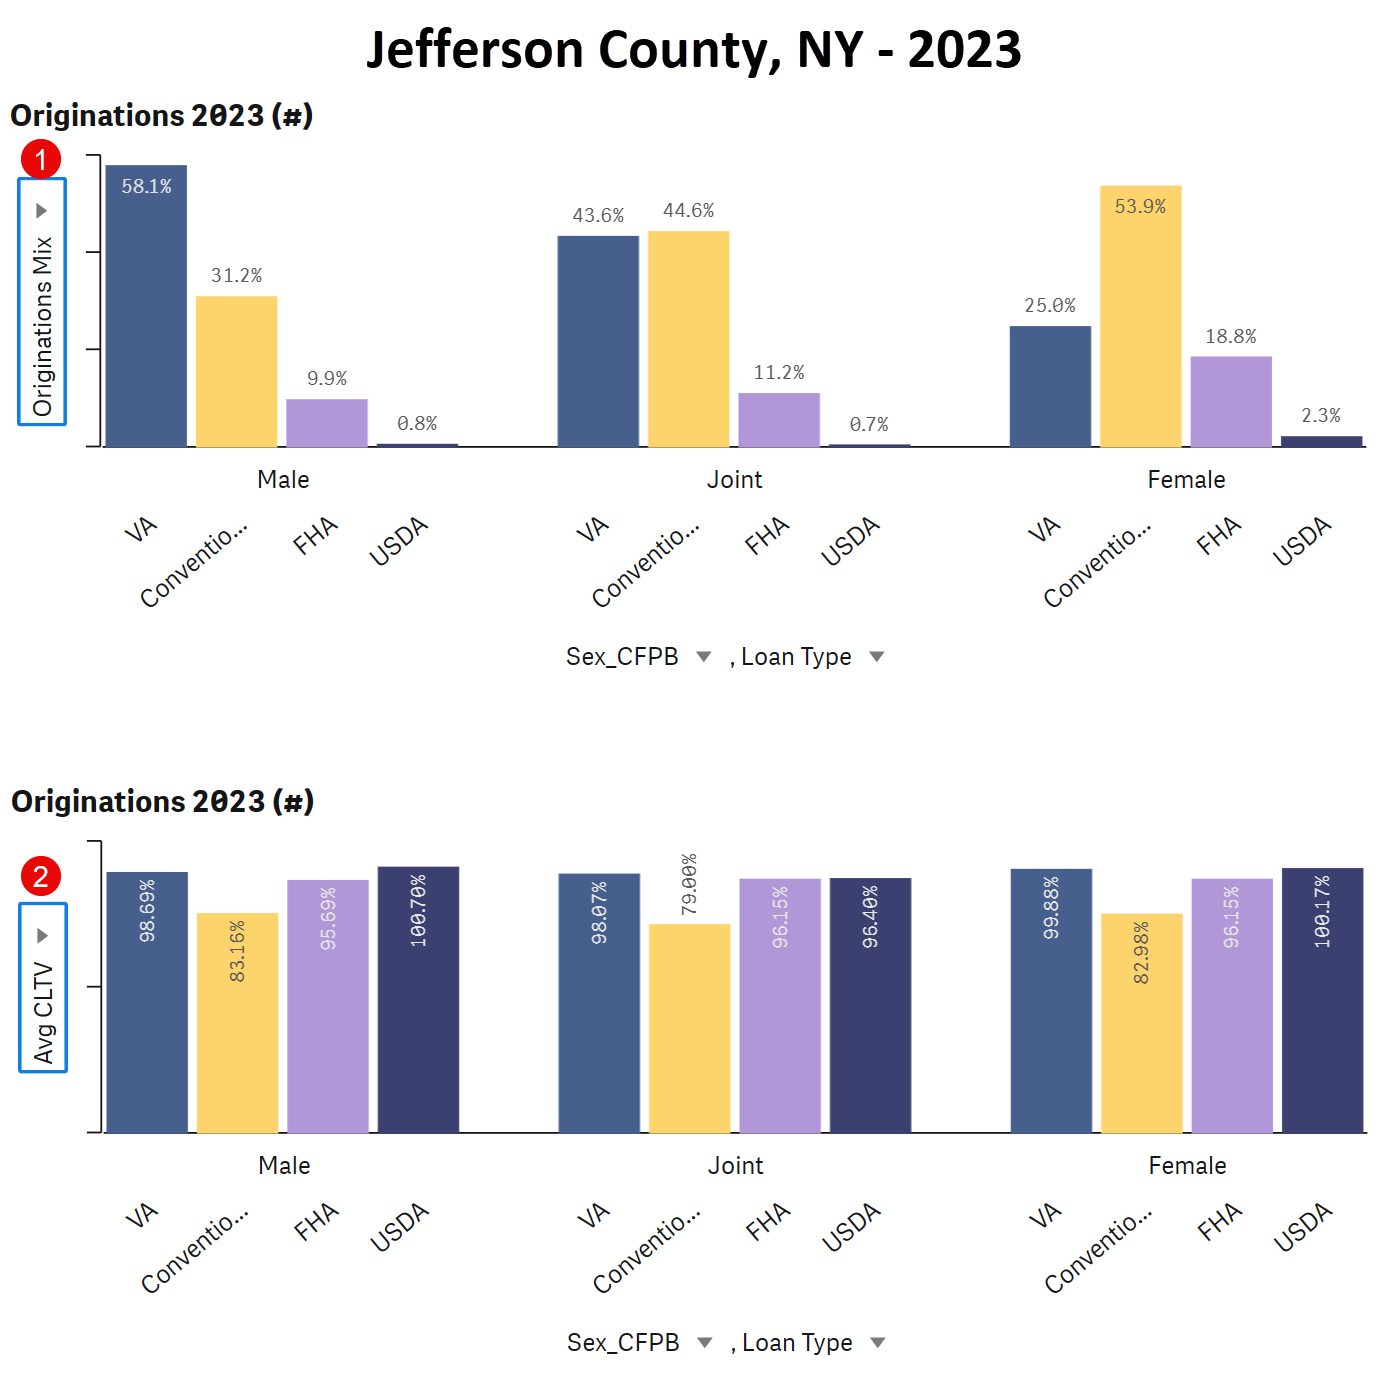
By using the complete dataset, we can make definitive observations about the presence or absence of discriminatory lending practices. This approach simplifies communication with stakeholders, as we discuss clear patterns and trends rather than explaining p-values or confidence intervals.
This is not to say that statistical methods lack value. They are particularly useful in sample-based studies or when predictive analytics is involved. However, in fair lending, where the full dataset is available and the stakes are high, it’s imperative that we prioritize direct observation over inference.
Actual differences in data can lead to more tangible and actionable insights. They inform stakeholders clearly about what is happening in the market and empower them to make data-driven decisions. When it comes to fair lending, what truly matters is not whether a disparity passes a statistical test, but whether it exists—and if so, what we are going to do about it.
This thorough analysis not only leads to better quantification of fair lending risk, but also to better understanding of a lender's business, including opportunities for growth, especially considering that it can easily be performed in every metro area, every county, and for every reporting lender in the U.S.
Shifting the Paradigm with Disparity Indices
It's not just about whether differences exist, but the extent to which they manifest in real-world outcomes. This is where disparity indices come into play, a methodological pivot from statistical significance to practical significance. Using the comprehensive loan-level HMDA LAR data, HMDAVision calculates disparity indices dynamically allowing for filtering on a vast number of loan attributes, geographies, lenders, and borrowers, that quantify the extent of discrepancies in loan outcomes between different demographic groups. Take, for example, our comparative underwriting disparity indices which include both Approval Disparity Index (ADI) and Denial Disparity Index (DDI). The table below shows a comparative underwriting disparity analysis for a bank compared to its peers.
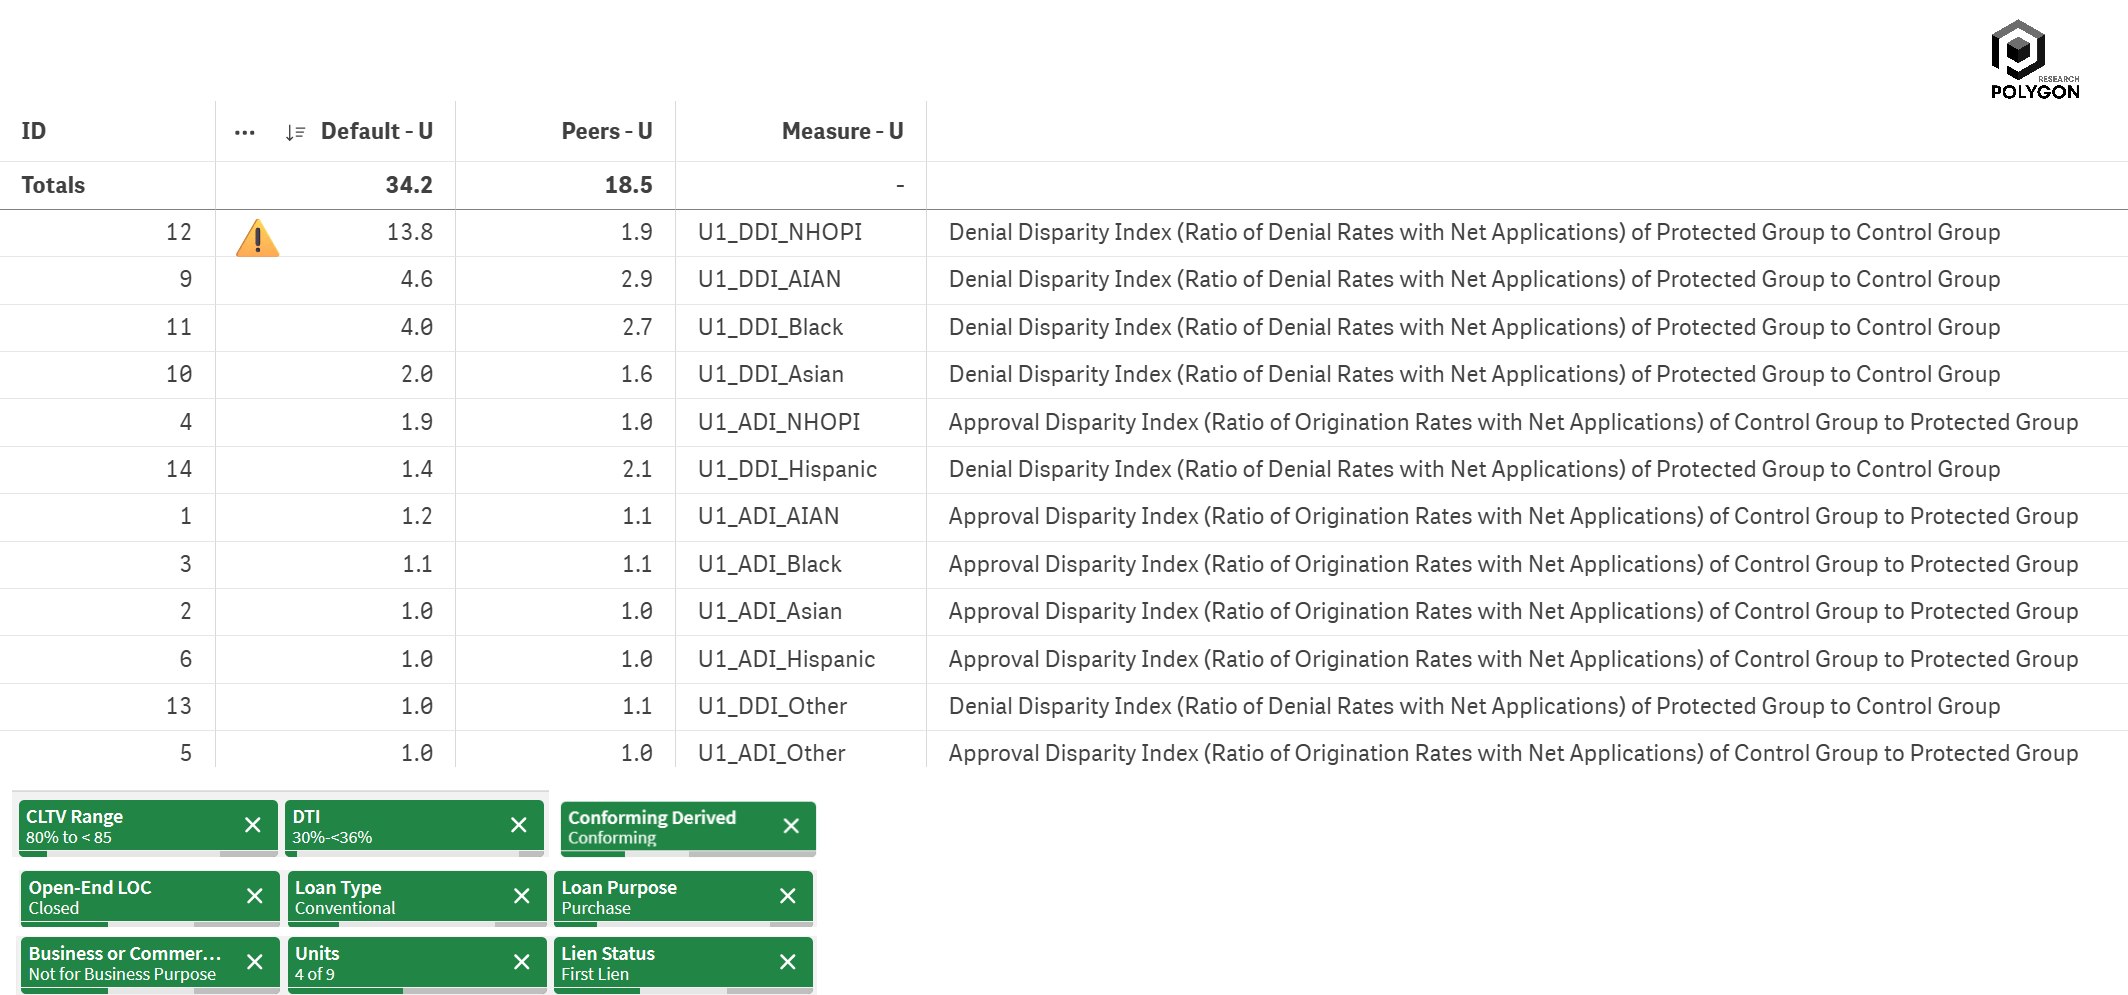
These indices are ratios that compare the approval and denial rates for protected demographic groups (like applicants from racial or ethnic minorities) against a control group (non-Hispanic White applicants in this case). An ADI or DDI of 1 would indicate parity, whereas a value greater than 1 reveals the disparities in loan outcomes. When DDI is greater than 1, it indicates a higher denial rate for the protected group, signaling possible disparities in the underwriting process. In addition to the individual bank/lender DDI (Default-U), HMDAVision calculates the DDI of its Peers, allowing a 360° view of its underwriting outcomes.
In HMDAVision, there are about 70 disparity indices measuring every aspect of lender's performance - redlining, marketing, underwriting, pricing/steering.
Traditionally, statistical significance has been used to infer whether observed disparities in a sample could be generalized to the population. However, with HMDAVision's use of loan-level data, we directly measure the outcomes across the entire population of loans. This direct measurement means that we are observing the actual disparities without the need to infer or rely on statistical tests. Our approach replaces abstract concepts of chance with concrete, observable data, offering a more immediate and actionable understanding of lending practices. The indices thus serve as a powerful tool, not just for compliance with fair lending regulations, but for proactive management and improvement of lending processes.
When the full scope of data is accessible, the need for hypothesis testing diminishes. Our focus shifts towards understanding the real-world impact of lending practices, allowing us to better communicate with both internal and external stakeholders and to develop effective interventions. It's a call to embrace the significance of the actual, over the theoretical, to ensure fairness in lending. With the advanced capabilities of HMDAVision, we step beyond the traditional realm of statistical significance and into the domain of direct, actionable disparity measurement. As the industry continues to grow and the demands for fair lending become increasingly precise, embracing loan-level microdata analysis is not just innovative; it's imperative.
Acknowledgement
This exploration into HMDA LAR loan-level data analysis underlines our commitment to full transparency and fairness in mortgage lending. It highlights the shared knowledge and analytical sophistication that HMDAVision brings to the industry, and with it the actualization of data, making it actionable for better outcomes for all.