
Before we can measure any aspect of a lender's performance, we need to understand what data is needed and what kind of metrics and KPIs can be created from the available data sets.
From data to metrics
Before we can derive information from data, the data goes through a cycle of acquisition, collection, preparation/transformation, modeling, analysis, and finally presentation. The mortgage banking industry not only consumes but also produces billions of transaction-level data points. For example, lenders are required under the Home Mortgage Disclosure Act (HMDA) to report certain data points connected with a mortgage application. Since 2018, these data points have expanded to include many more aspects of the mortgage transaction, including fees, lenders credits, discount points, interest rates, in addition to expanded applicant demographic disclosure. Since the data is disclosed at the loan-level, this presents a strategic opportunity for lenders and all stakeholders to use the data - 90+ million loan-level transactions over the past 5 years - to derive insights and make informed decisions.Additional data sets highly relevant in mortgage lending include the American Community Survey Data (1-year, 5-year, PUMS/microdata or summarized), Current Population Survey (CPS, monthly and ASEC), the Community Reinvestment Act Data (CRA), and many other public data sets. In addition to these public data sets, lenders produce many a great wealth of raw data points collected throughout the entire loan lifecycle.
Since this data offer the promise of understanding the market trends responding effectively to gaps and opportunities, it's important to think about how to activate the chosen data set (or combination of data sets) in order to derive useful information.
The journey from data to metrics
Data exists on a continuum from data point to metric to Key Performance Indicator (KPI). For example, an application for a loan (e.g. conventional-conforming purchase mortgages for 1st lien, forward, closed-end, 1-unit property in Miami) is a data point. Tallying many such applications came from low-income applicants produces a metric. And measuring your progress in this target against your goals is a KPI.Figure 1 illustrates the high-level phases of mortgage data points to metrics and KPIs. KPIs often represent benchmarks (e.g. against peers, or market) or corporate targets set by the lender's executive leadership.
Figure 1: From Data to Metrics
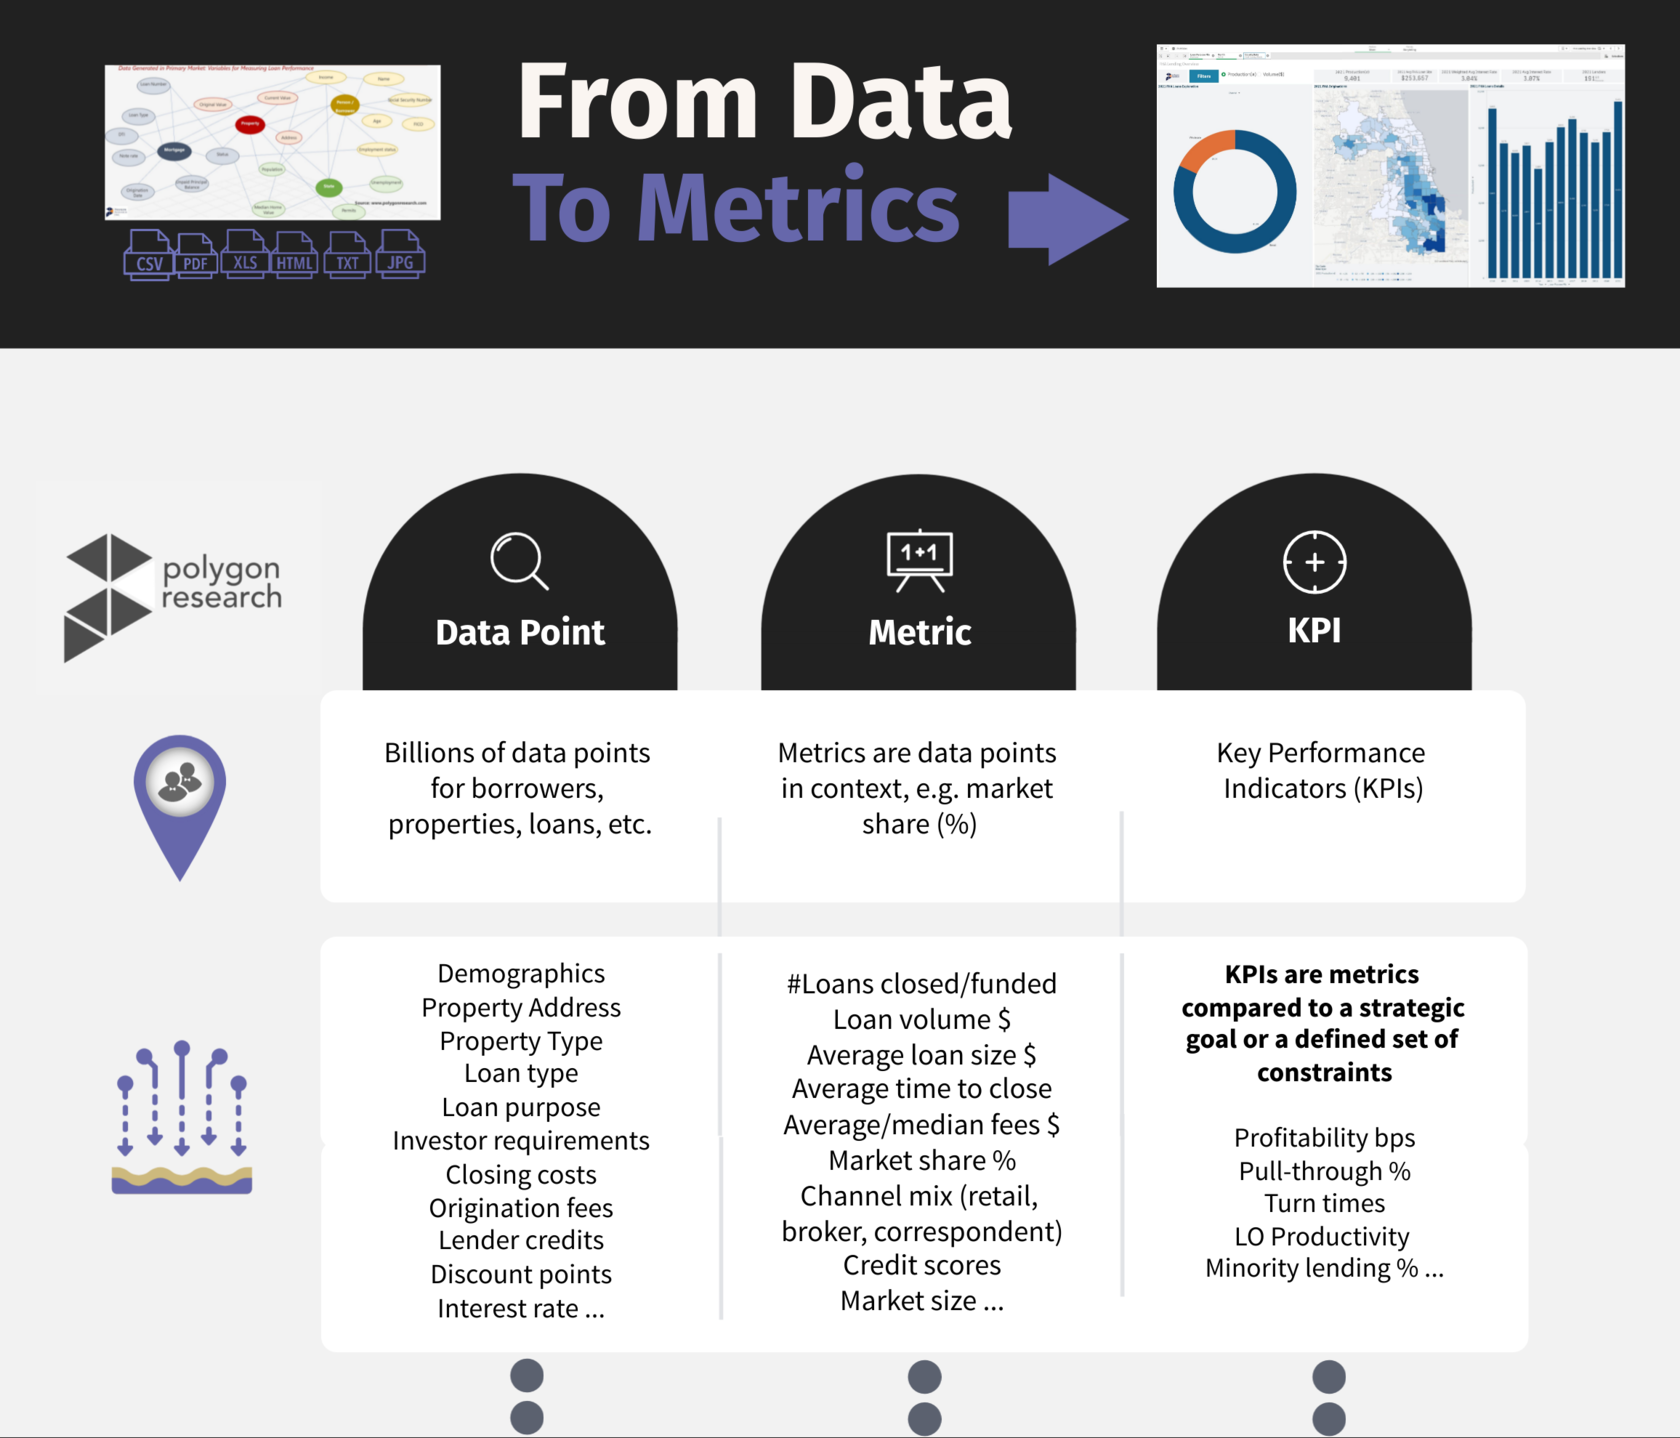
Of course, this is an oversimplified framework, but it illustrates one of the most important aspects of working with data in the mortgage banking industry - the domain knowledge of the analyst. Understanding the mortgage banking value chain (from customer interaction and application intake to closing to sale to secondary market investor to servicing the loan) determines the choice of data sets and how insightful the analysis of the data would be. This in turn determines what KPIs and metrics need to be tracked in order to profitably manage the lending organization.
How well the KPIs and metrics are defined, how well they represent the drivers of the business that the lender wants to control, and how well they leverage all the data to avoid bias (e.g. in underwriting decisions which use AI algorithms), determines whether the lender wins with analytics or continues to make decisions on "gut feeling", missing the chance for a data-driven decision-making transformation.
Leading vs. Lagging Indicators
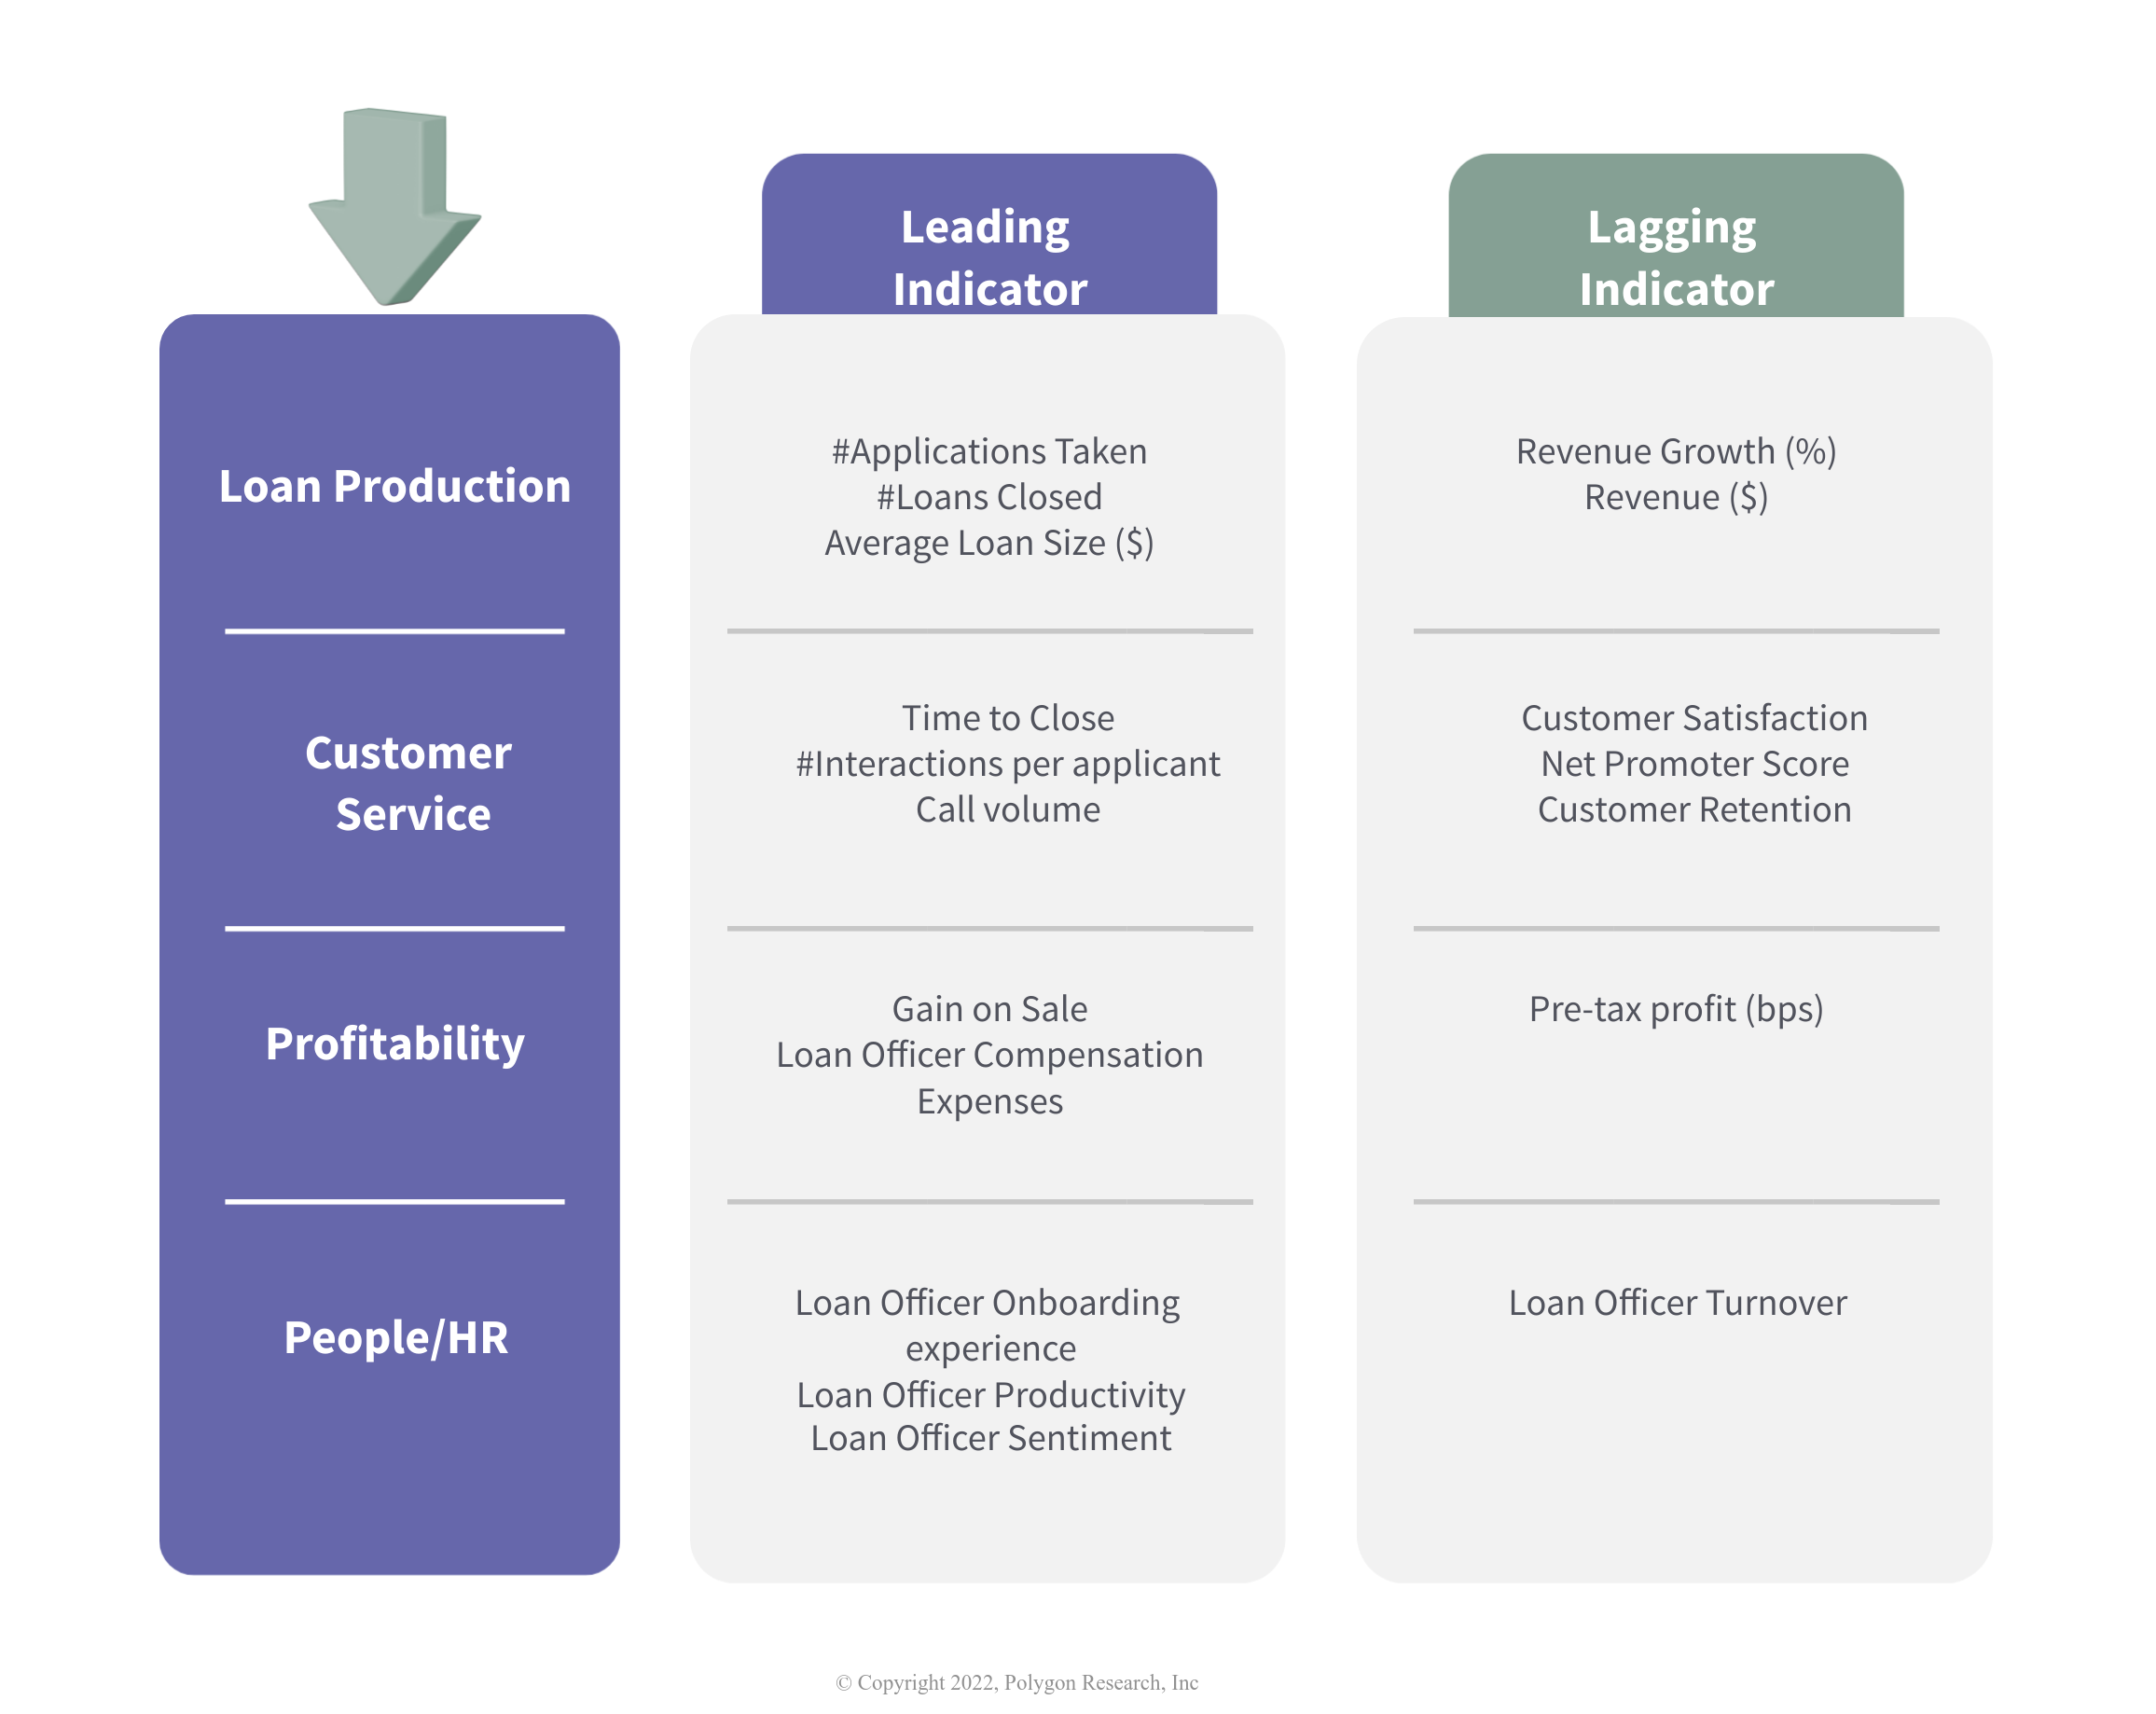
Leading indicators are metrics that lenders monitor and that serve as an early warning system. They alert the lender's leadership to events affecting the outcome of its strategy. It allows the lender to respond to that with tactics that will ensure hitting the strategic goals of the organization.
The lagging indicators are the outcome. They are metrics that measure lender's sales and operational strategy, and they cannot be changed. For example, at the end of reporting period, the lender measures its actual revenue growth, or NPS, or loan officer turnover, as illustrated in figure 2.
Figure 2: Illustration of Leading and Lagging Indicators in Mortgage Banking
We'd love to hear from you. Which KPIs do you monitor? What leading and lagging indicators do you track? Contact us for a free 30-minute analysis of your data strategy and KPIs.