For our blog this month, we chose to look at the average interest rate progression from March 2020 through November 2021. The interest rate is the annual interest rate on the mortgage note or deed of trust established at the time of Firm Commitment. In Figure 1, we look at the national average interest rates. In Figure 2 and in the video, we go further back to February 2010, in order to examine the patterns of FHA purchase mortgage interest rates and FHA purchase mortgage production.
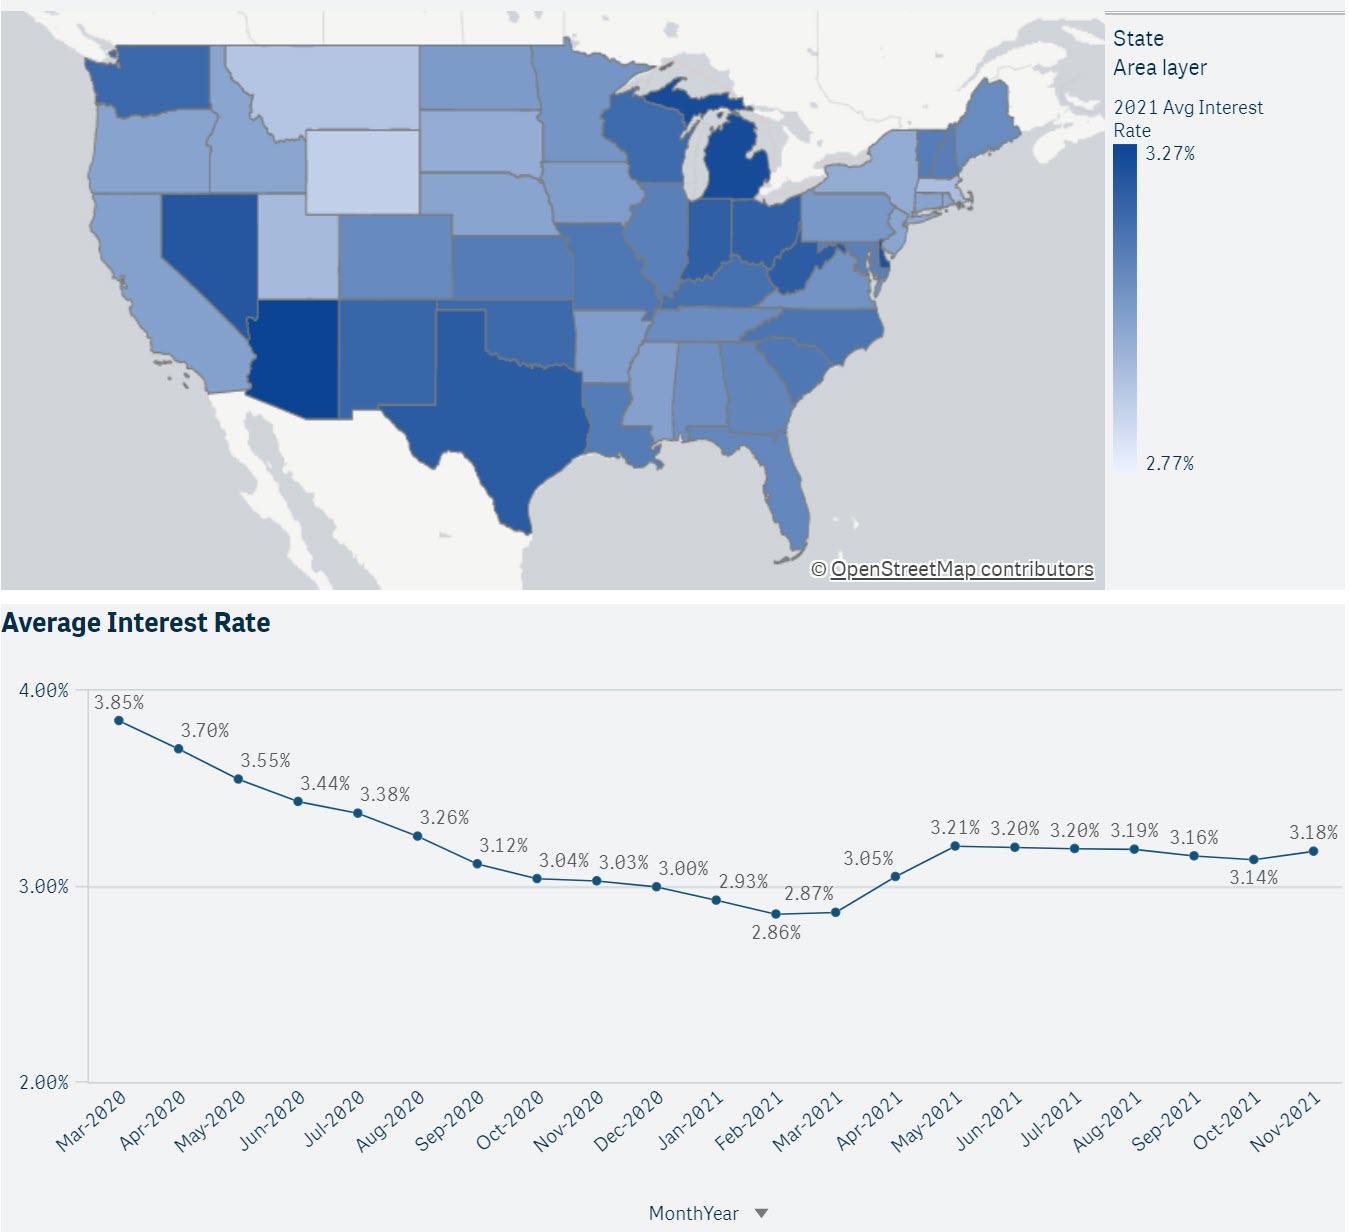
The map in Fig. 1 illustrates how the 2021YTD average FHA purchase mortgage interest rates vary by state from 2.77% in Alaska to 3.27% in Arizona. In the line chart under the map, we see the steep decline by almost a percentage point from 3.85% in March 2020 to 2.86% in February 2021. From February to May, the average interest rate increased by 35 basis points, and then stayed fairly stable and flat. In November, we saw an uptick in the average interest rate. This trend is expected to continue as the Fed implements various quantitative measures, from raising the federal fund rates to easing or stopping MBS monthly purchases inn 2022.
Figure 1: Average Interest Rate By State and By Month from March 2020 to November 2021
The effect of rising interest rates would be felt on the FHA refinance volume. However, the purchase production might behave differently as there are many more factors that come into play that regulate the consumer behavior. We used FHAVision to look as far back as February 2010 to see the patterns of interest rates by month. The highest interest rate (on average) was 5.15% and there were just a few months with this interest rate (see the video below).
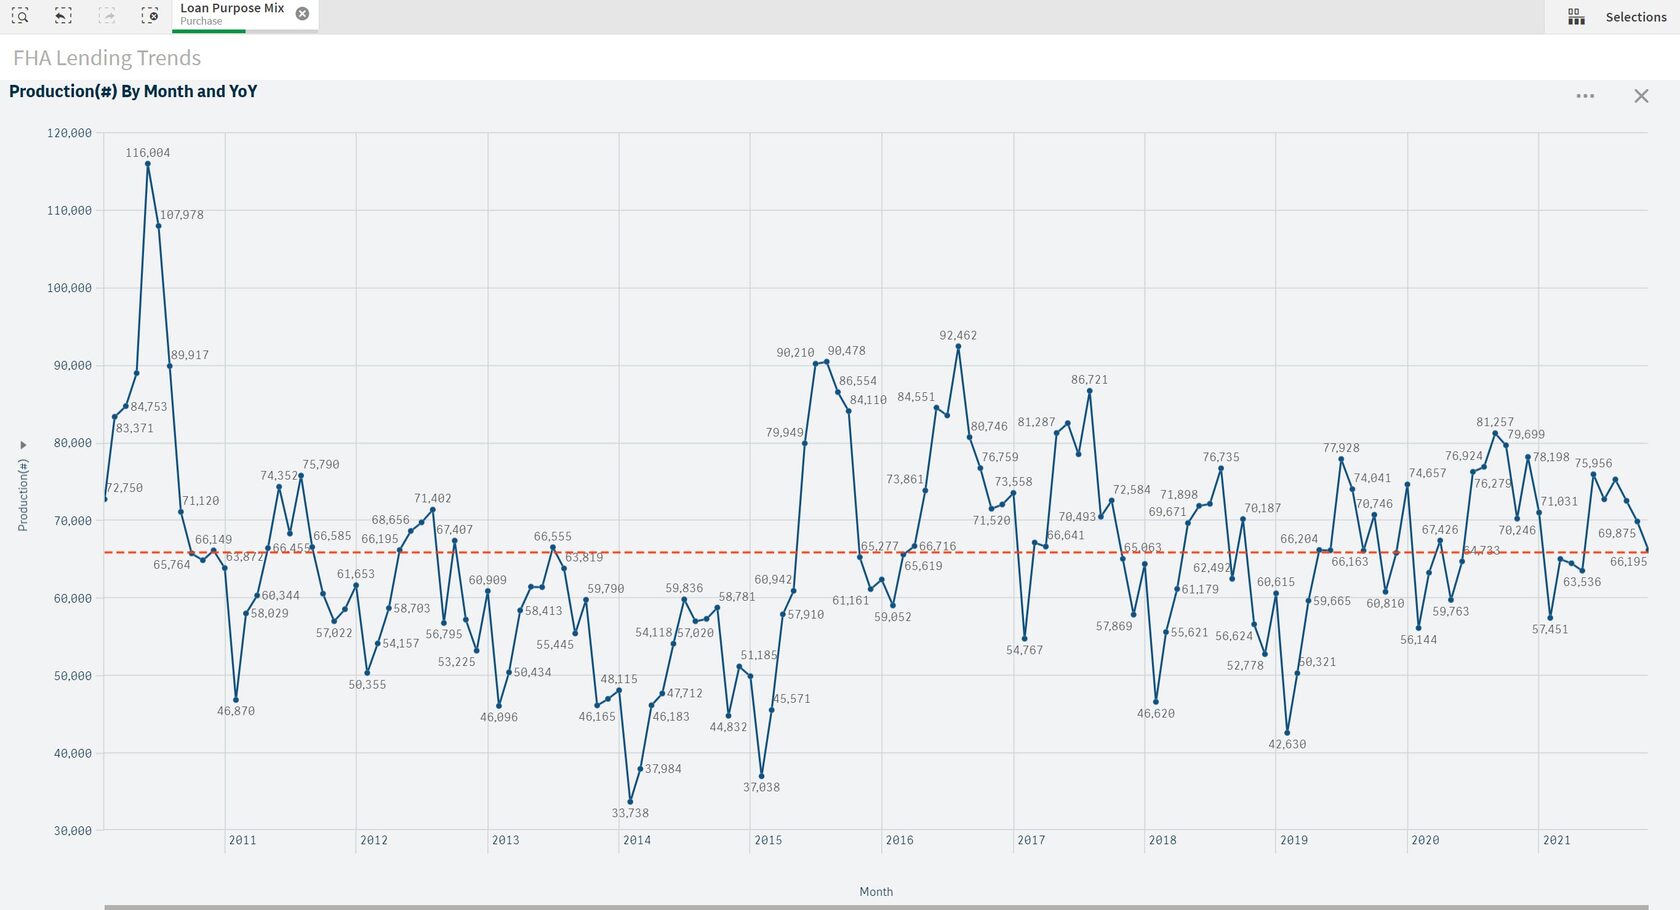
We expect that the FHA purchase production would stay stable, on average 60,000-70,000 loans per month, as shown in Figure 2. In some years, like 2018, for example, the interest rate sharply rose to 5.15% but the FHA monthly purchase loan production kept going up between February 2018 and August 2018. In 2022, the rising interest rates might slow down the FHA loan production overall, but we are optimistic for the future of FHA purchase originations.
Figure 2: Monthly FHA purchase production (February 2010 - November 2021)
For further insights and exploration, visit Free Resources in our store to download the latest 2021 FHA Infographic, or you can subscribe to FHAVision for detailed insights in all markets. For more information visit: Polygon Research.