
Every month we take a look at the state of FHA lending by leveraging our app, FHAVision. FHAVision is an interactive dashboard of monthly FHA endorsement data by originator and sponsor.
With historical data dating back to 2010, we pull in current data each month as soon as it is published by HUD. Our users have access to loan-level data on 1300+ lenders by loan purpose, channel, and interest rate, with geographical analysis of FHA lending trends from the national level down to zip code. With this month update, FHAVision has 12 years of monthly FHA originations down to the zip-code level.
2021 ended as a relatively strong year, just slightly higher than 2020, making it the third best year for FHA mortgage production. In 2021, the FHA loan production was driven by refinance as the average interest rate dropped to 3.02% from 3.37% in 2020. See chart below.
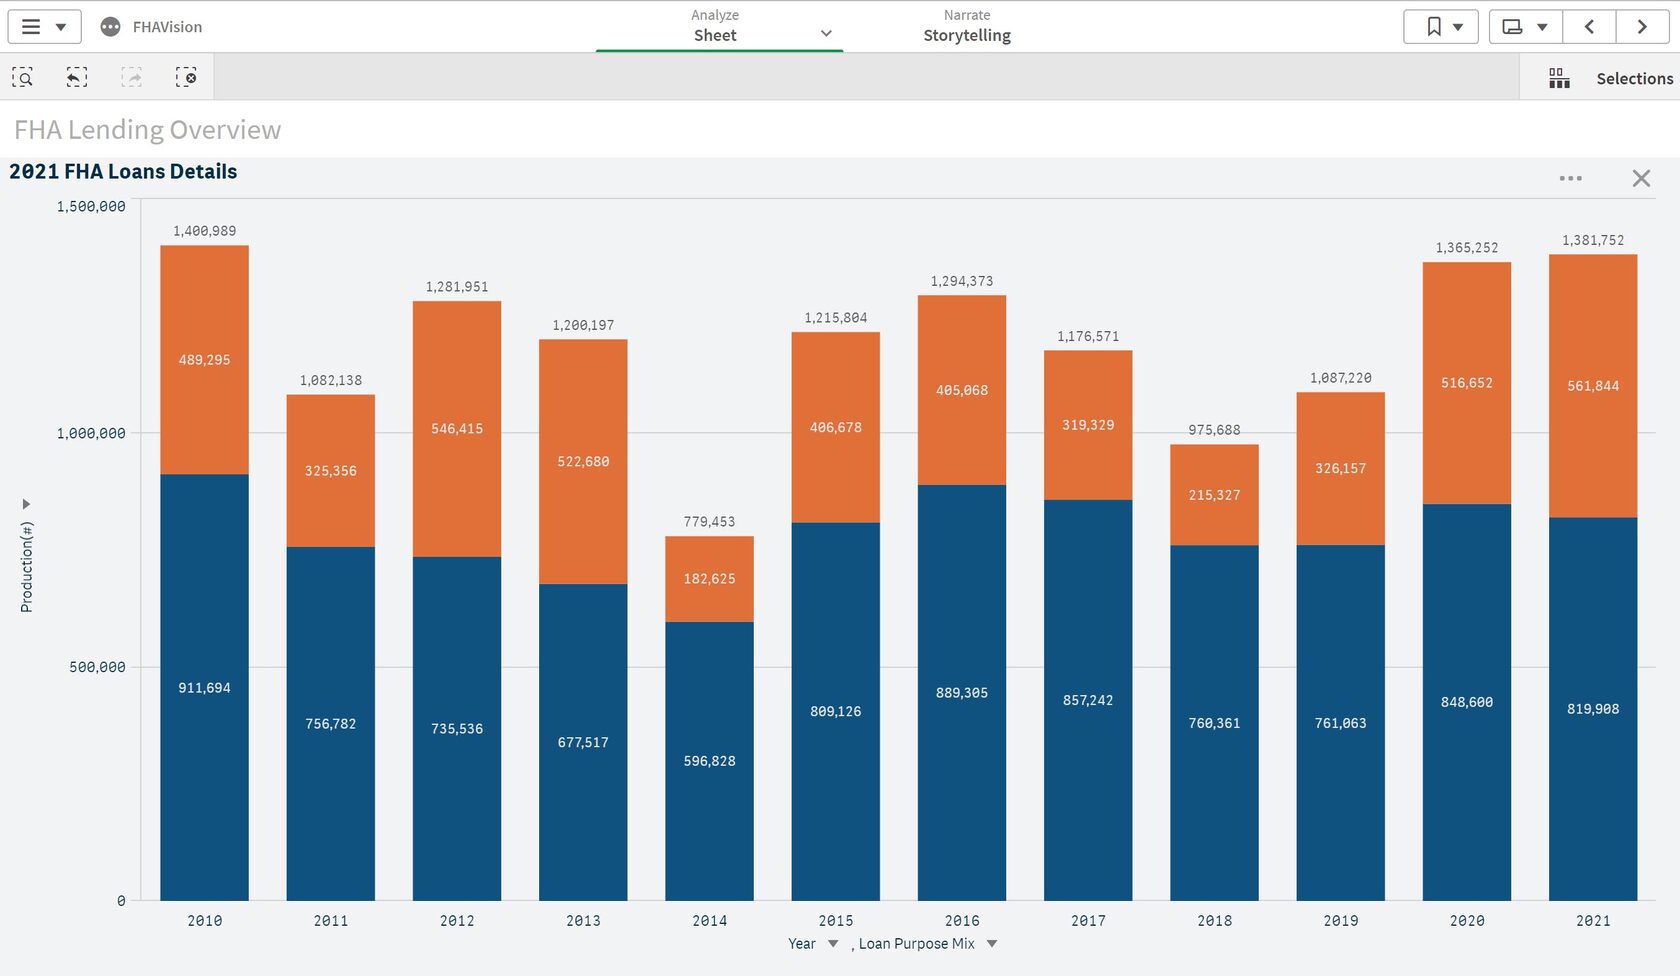
In the last 12 years, the average monthly interest rate on a FHA loan was 5.12% or lower, and the purchase mix typically was 70% of FHA loans. The purchase mix was 59.3% in 2021 when the average interest rate was 3.02%, and 77.9% in 2018 when the average interest rate reached 4.72%. Given the market expectations that the mortgage interest rates would continue to increase in 2022, we expect the FHA purchase mix to increase to levels seen in other years when the interest rate was in the upper 4's.
For further insights and exploration, visit Free Resources in our store to download the latest 2021 FHA Infographic, or you can subscribe to FHAVision for detailed insights in all markets. For more information visit: Polygon Research.