
We first take a look at the disparate impact terrain with regard to how individual lenders can utilize HMDA data to inform themselves of gaps in their lending practices in order to mitigate regulatory risk and potential litigation down the line. At Polygon Research, we aim to interpret data objectively, with the intent to enable our clients to best tell their story. In the next blog in this series, we will focus on how to utilize our apps to look for specific target markets for establishing special purpose credit programs as part of the solution to increase lending to minority borrowers.
New Policies in 2020
HUD’s New Disparate Impact Rule
Disparate impact issues arise when a lender applies a policy or practice equally to all applicants, but functionally it has a disproportionately adverse impact on protected status groups. In October 2020, the Department of Housing and Urban Development (HUD) issued a clarificatory rule with regard to raising litigation cases, making it more onerous for plaintiffs to pursue disparate impact claims through prescriptive burden of proof requirements. Plaintiffs must now be able to pinpoint “a specific, identifiable policy or practice” and provide evidence that the challenged rule is the “direct cause” of discriminatory effects that are “significant”. In the case that the policy can be justified with a defendant’s “valid interest”, plaintiffs must then prove that an alternative, less discriminatory practice could serve the defendant’s same business interest without unduly increasing their costs or other burdens. While the rule currently makes it more difficult to pursue disparate impact cases, we believe they are set to remain a large part of the mortgage lending litigation landscape going forward due to the tension between the structural inelasticity of underwriting standards on the one hand and the desire for faster change in minority lending on the other.
Special Purpose Credit Programs
Moreover, in December 2020 the Consumer Financial Protection Bureau (CFPB) issued an interpretive rule to Regulation B, which implements the Equal Credit Opportunity Act (ECOA), with the explicit aim to resolve uncertainties surrounding creditors' establishment and administration of special purpose credit programs. Such programs could be utilized to address market gaps by creating an avenue through which lenders can extend credit to specifically targeted protected classes. This would include minority groups that would otherwise be unable to receive credit or favorable lending terms when evaluated by an institution’s standard approach to creditworthiness. In our next blog, we will show how lenders can use our apps to find such target markets.
Global Lending Gaps
Delving into the global US lending landscape through the lens of our flagship HMDAVision app, the latest data reveals plenty of areas with significant gaps that both lenders and regulators will focus on in the year ahead. We don’t believe in monocausal explanations or that the gaps are necessarily a sign of discriminatory practices. Nevertheless, knowing that they can be, let’s take a closer look at some of these market discrepancies.
Through our Closing Rate Analysis in the HMDAVision app, we highlight the following:
1. Overall, there is a higher denial rate for minority borrowers among all lending institutions
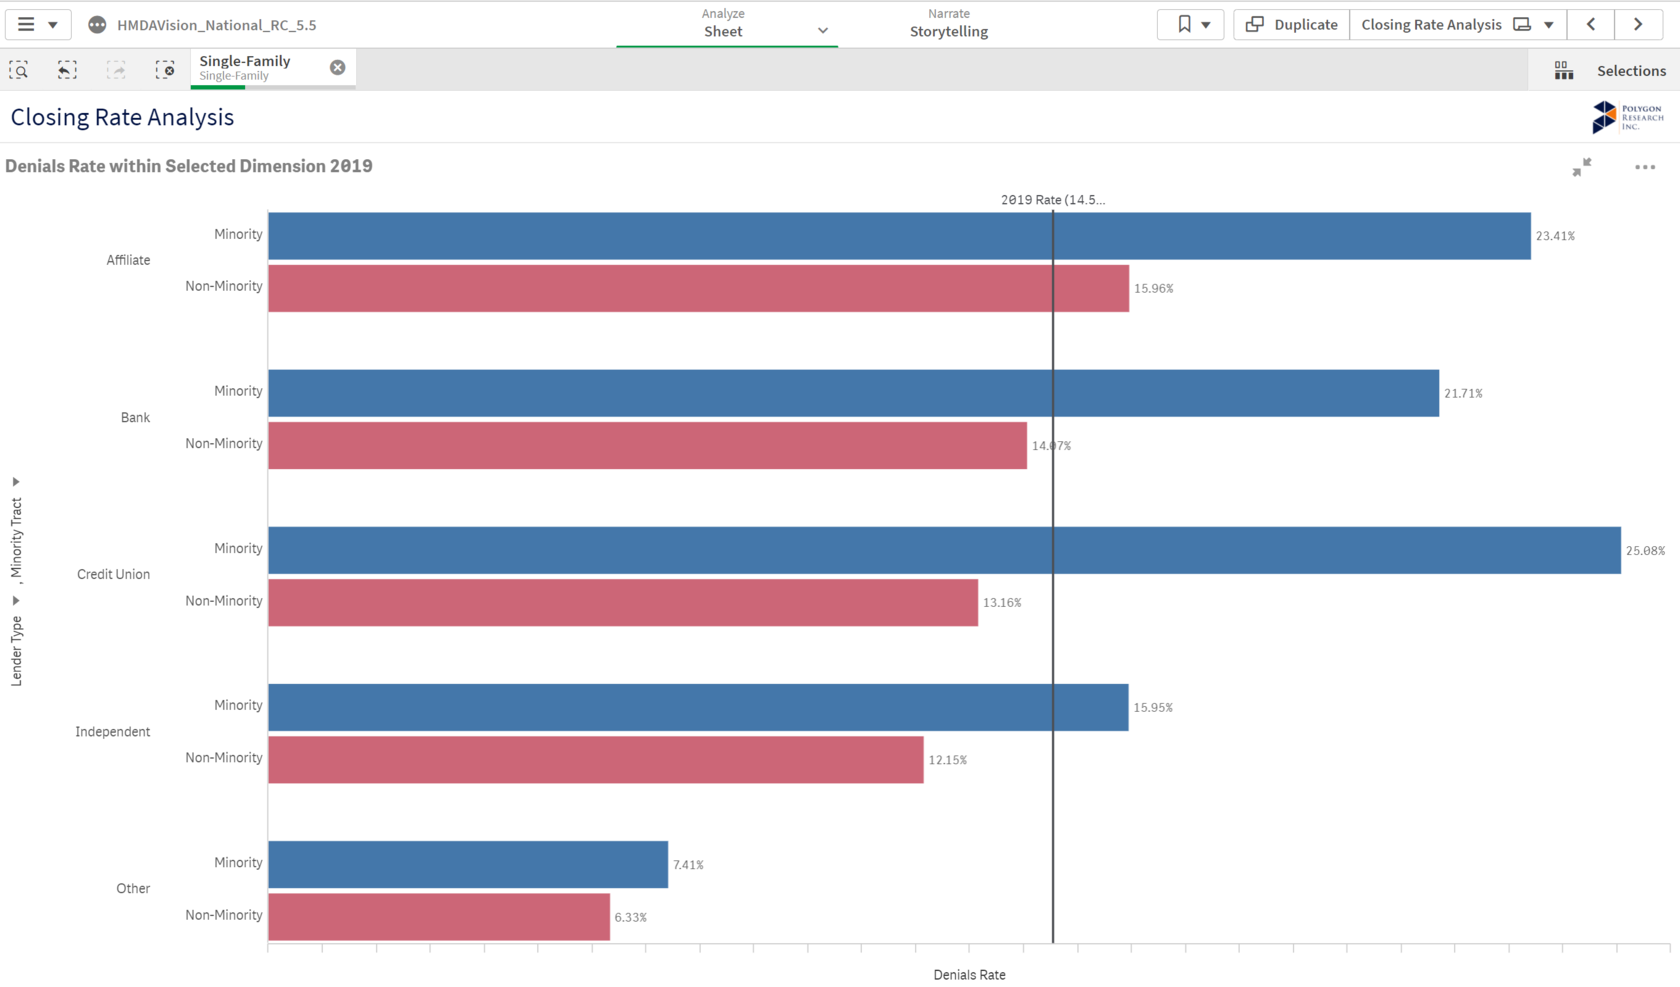
This type of analysis can be done on an individual lender basis in-app and also in comparison to a specific peer group. Moreover, lenders have the flexibility to dig into reasons for denials on a more granular basis and to visually tailor the data output to meet business needs.
2.Denial rates of minority borrowers vs. non-minority borrowers fluctuate with loan purpose
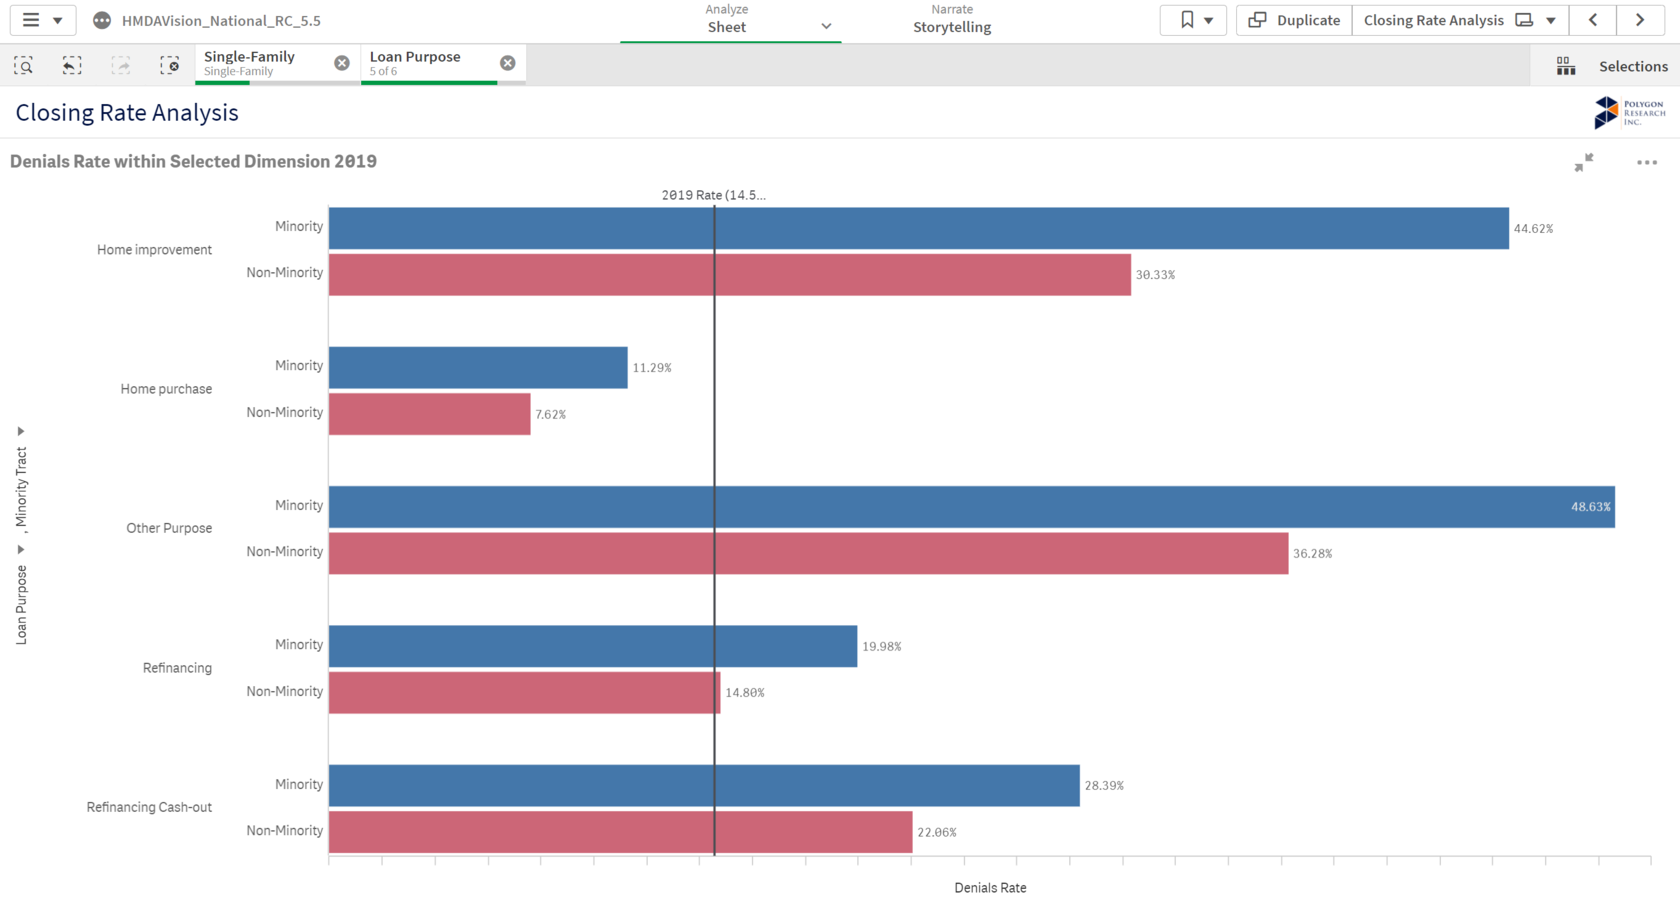
Lenders can choose to zero-in on different loan elements (by age, geography, time, loan properties, etc.) to examine where gaps appear to be the greatest. For example, our analysis shows that more significant gaps in denial rates for minorities emerge in Other Purpose and Home Improvement loans than for Refinancing or Home Purchase.
3. The denial rate discrepancy between minority and non-minority lending generally increases with age
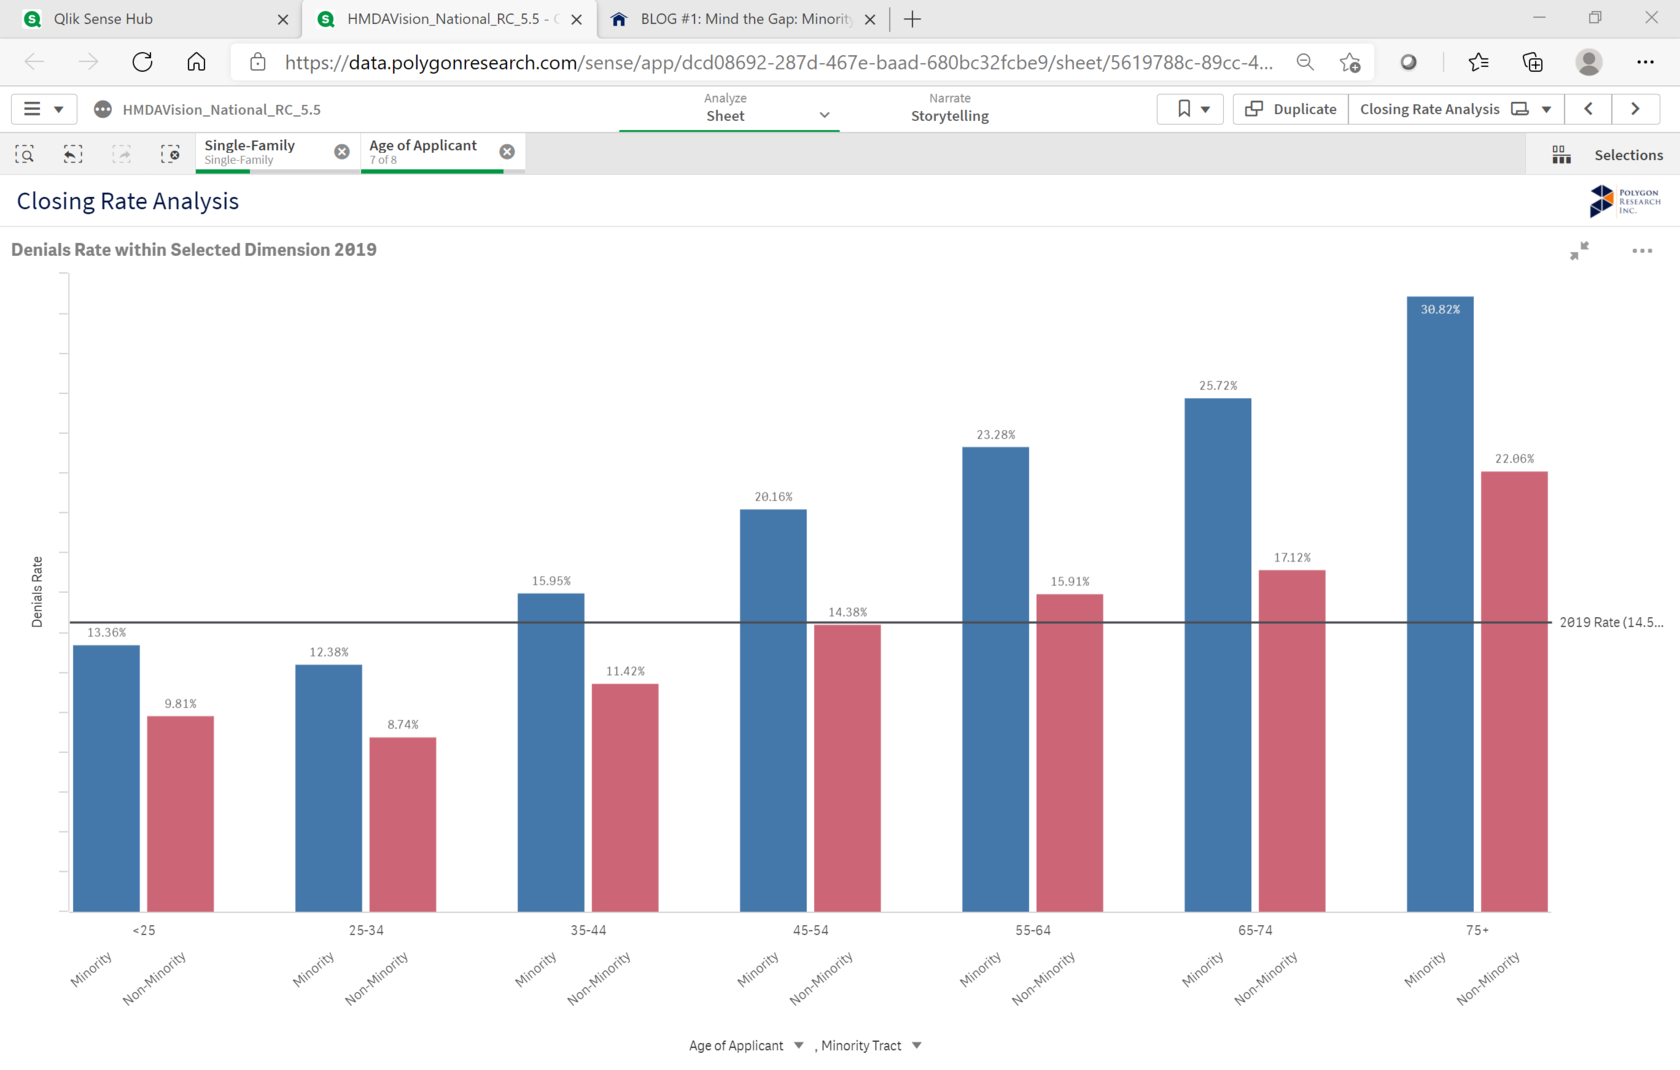
The widening gap could be due to many standard underwriting factors including number of applications, ability to make a down payment, lower credit scores, higher DTIs, and gaps in employment, among other things. From a regulatory standpoint, it is becoming increasingly important that lenders understand this data in the context of their own operational policies and practices.
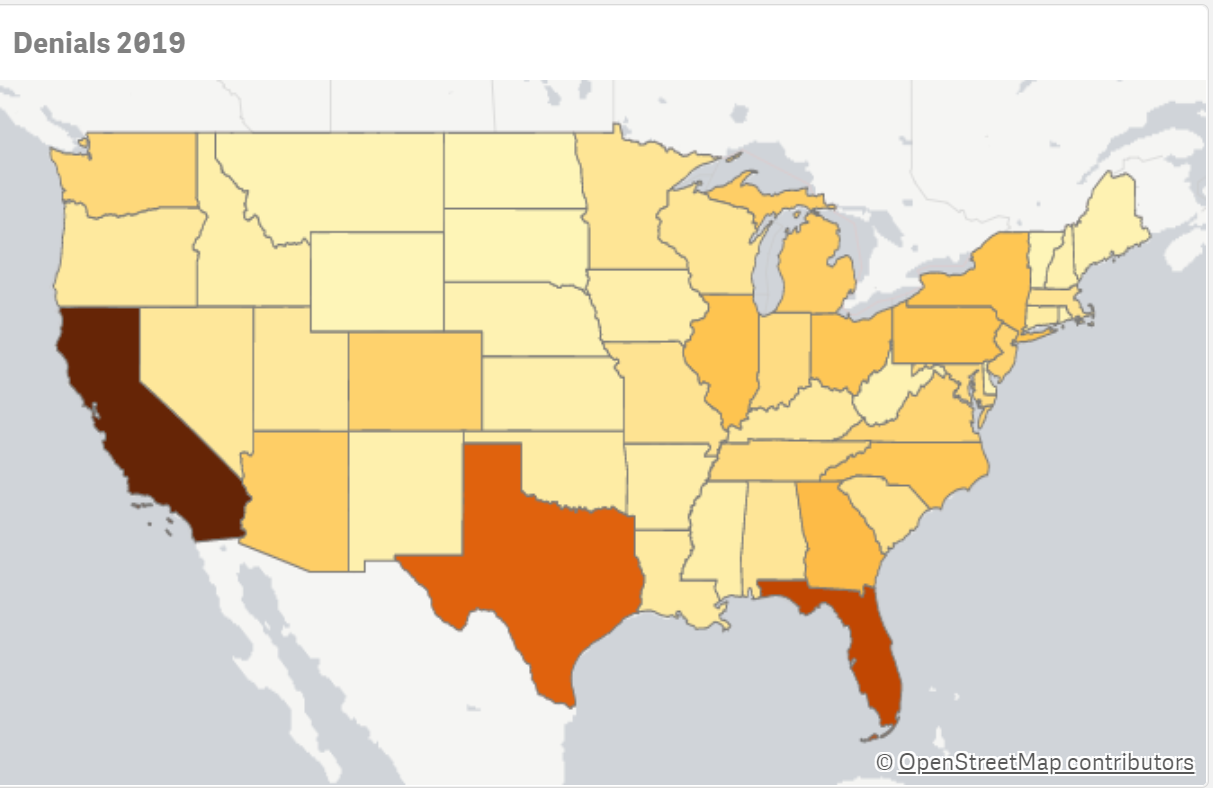
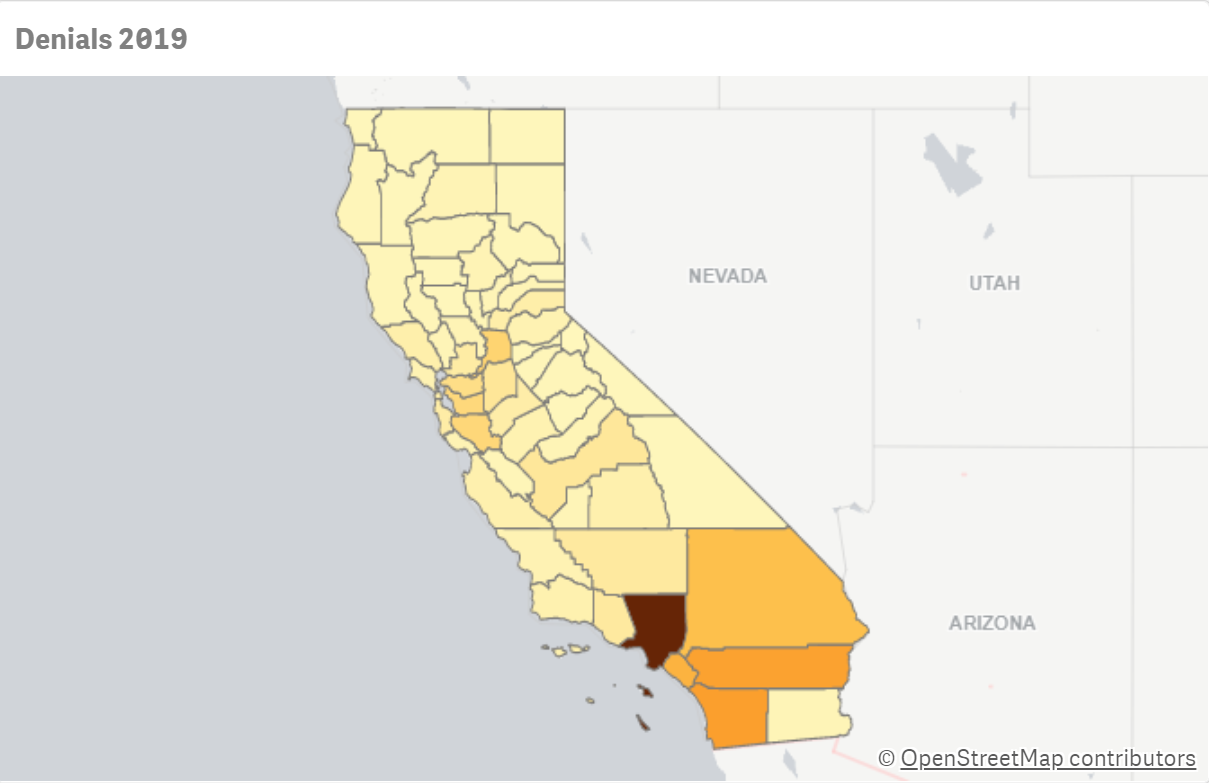
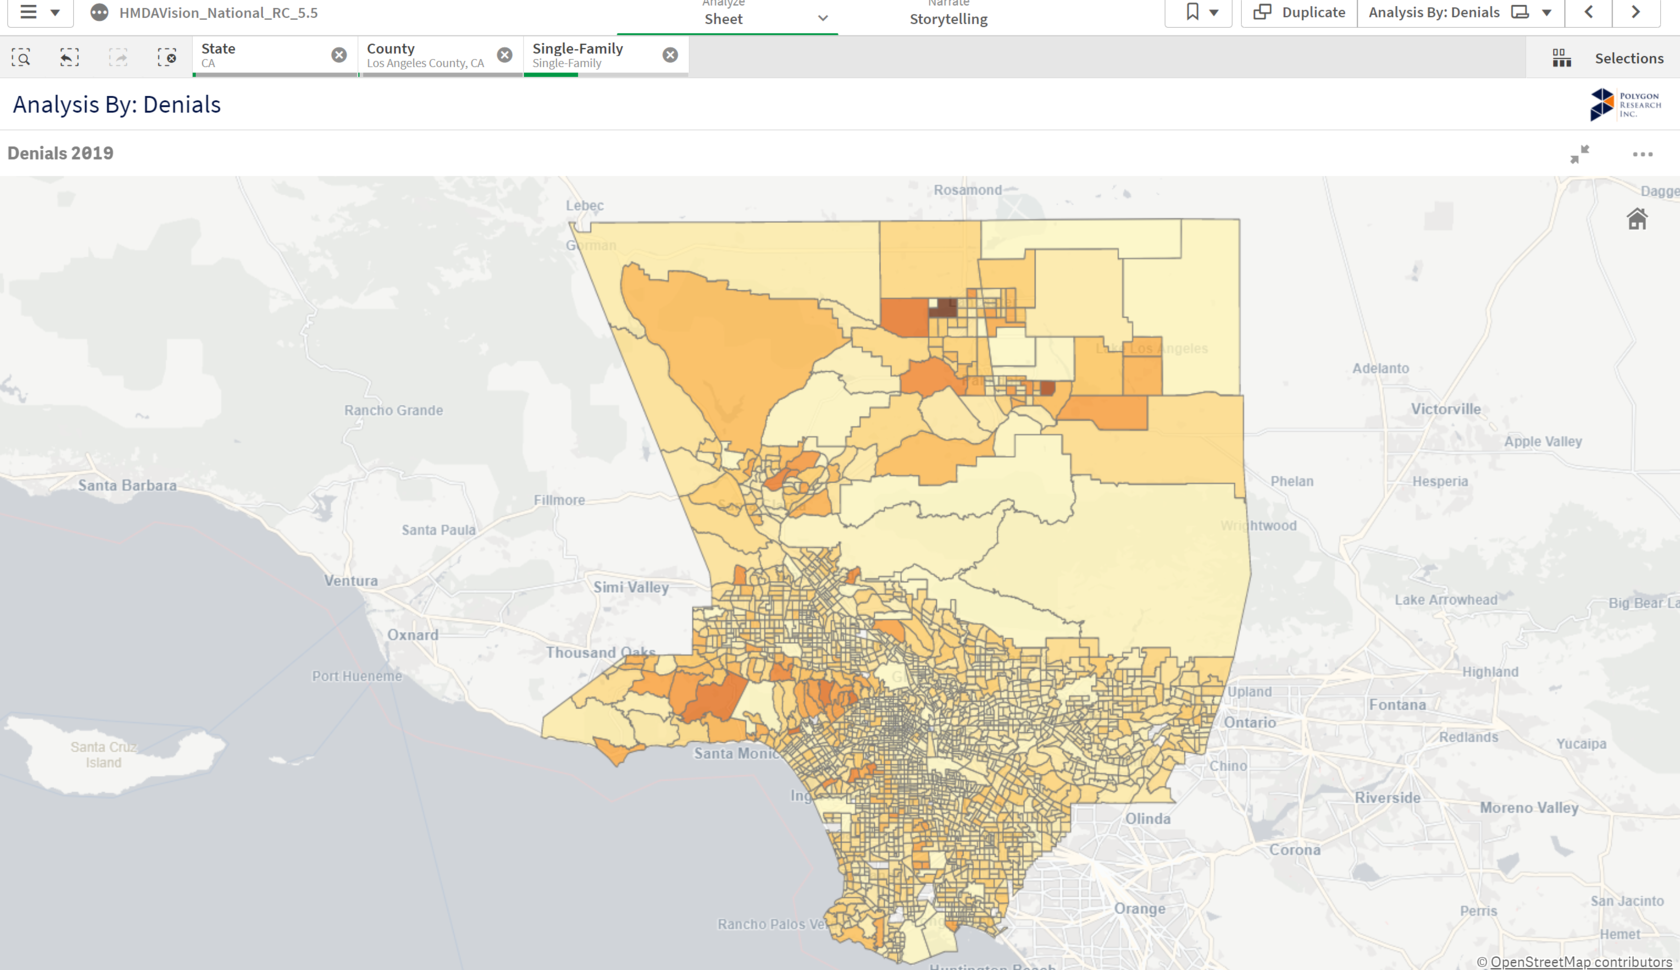
Taking a more detailed look, HMDAVision Analysis by Denials allows individual mortgage lending players to interpret the market landscape and tell their story through mapping and peer analysis. Most importantly, it allows users to undertake comparative analysis in the target segments in which they operate, by denial reason or by top geography, with the ability to drill down to an increasingly granular level of detail.

As an example, zoning in on California geographically by number of denials, lenders can use multi-level data to direct self-assessment of lending practices and examine how they stack up against market competitors. Creditors are able to view their number of denials in specific locations, down to the Census tract level, and in comparison to the number of applications received for the same geographical area. Moreover, our clients are able to enhance this research through exploration of their own data, for example by mapping out bank branches or ATMs in order to understand how well-served certain tracts are.
To undertake more focused Denials research, it is helpful to utilize our app’s comprehensive filter menu, allowing for further customization in loan, property, and applicant level fields. For example, it is possible to hone in on loan-level properties such as loan type, purpose, and amount, as well as applicant demographic factors such as age, ethnicity, race, and income, among many other options. Such research can be undertaken for every step of the underwriting process, with the explicit aim to help mortgage market players achieve their business needs.
With our powerful tools, we enable lenders to stay at the forefront of regulatory reform and enact data-driven change where necessary. For more information please visit www.polygonresearch.com/apps or sign up for a demo at www.polygonresearch.com/demo.