
2021 YTD FHA Lending is going strong both in terms of total originations (841,528) and in terms of loan volume ($200.8 Billion). In fact, the first 7 months of 2021 are the best in the entire data set, which dates back to 2010.
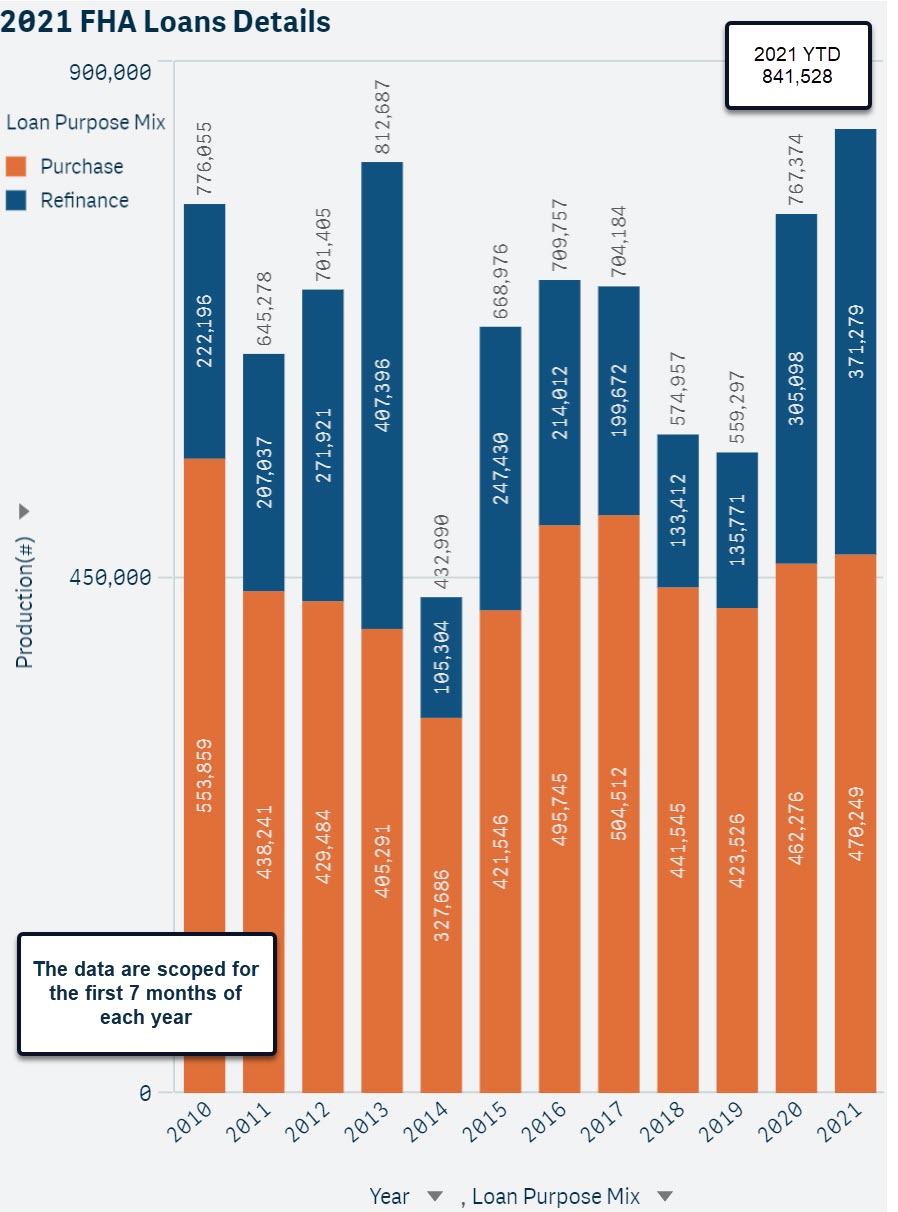
The main driver of loan volume has been FHA loan sizes, which have increased from an average of $176,608 in 2010 (first 7 months) to $238,593 in 2021 (first 7 months).
FHA Purchase Originations have delivered an average performance. At 470,249 they are lower than the FHA Purchase Originations in 2010, 2016, and 2017.
FHA Purchase Market Share
We looked into HMDA data to get a sense of how the FHA Purchase Market Share has changed in the last 5 years. We noticed that as a share of total purchase loan production, FHA Purchase has decreased from about 22% in 2015 to about 17% in 2020.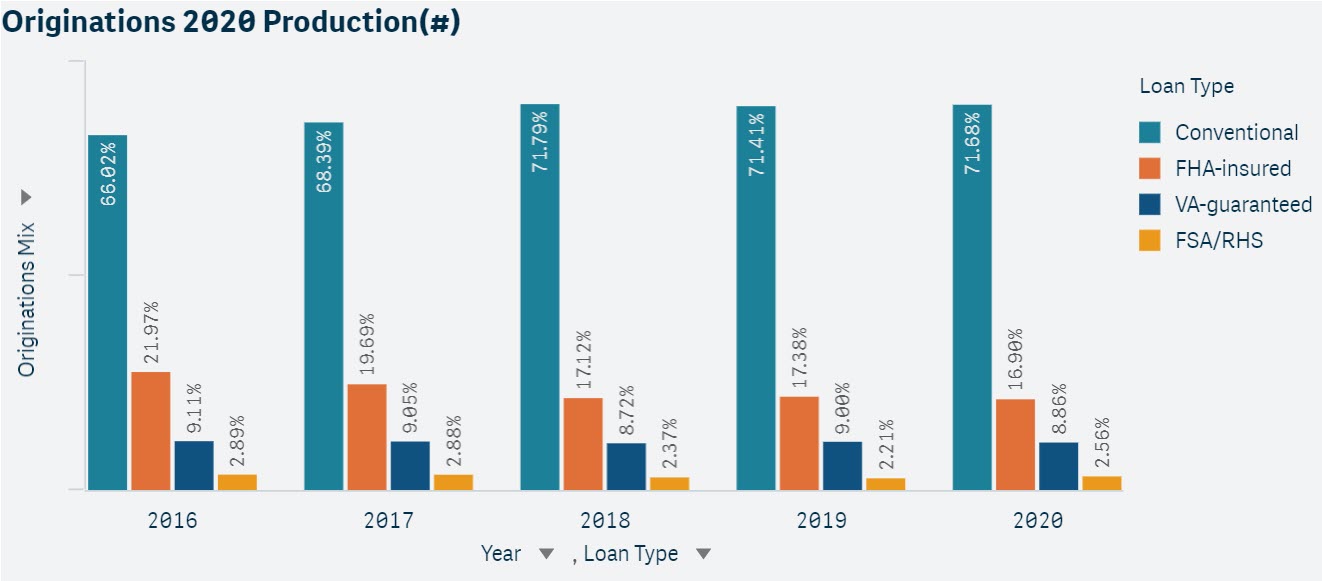
For further insights and exploration, visit Free Resources in our store to download the free July 2021 FHA Infographic, or you can subscribe to FHAVision for 24x7 access. For more information visit: Polygon Research.