What are some of the trends we noticed?
First, year-to-date comparison across 12 years shows that the first half of 2021 was a record for total FHA loan production. 724,503 FHA refinance and purchase loans were originated in the first 6 months of 2021. On the other hand, if we isolate FHA Purchase Loan Production for the first half of the year, it was only the fourth best, coming in after 2010, 2018, and 2017.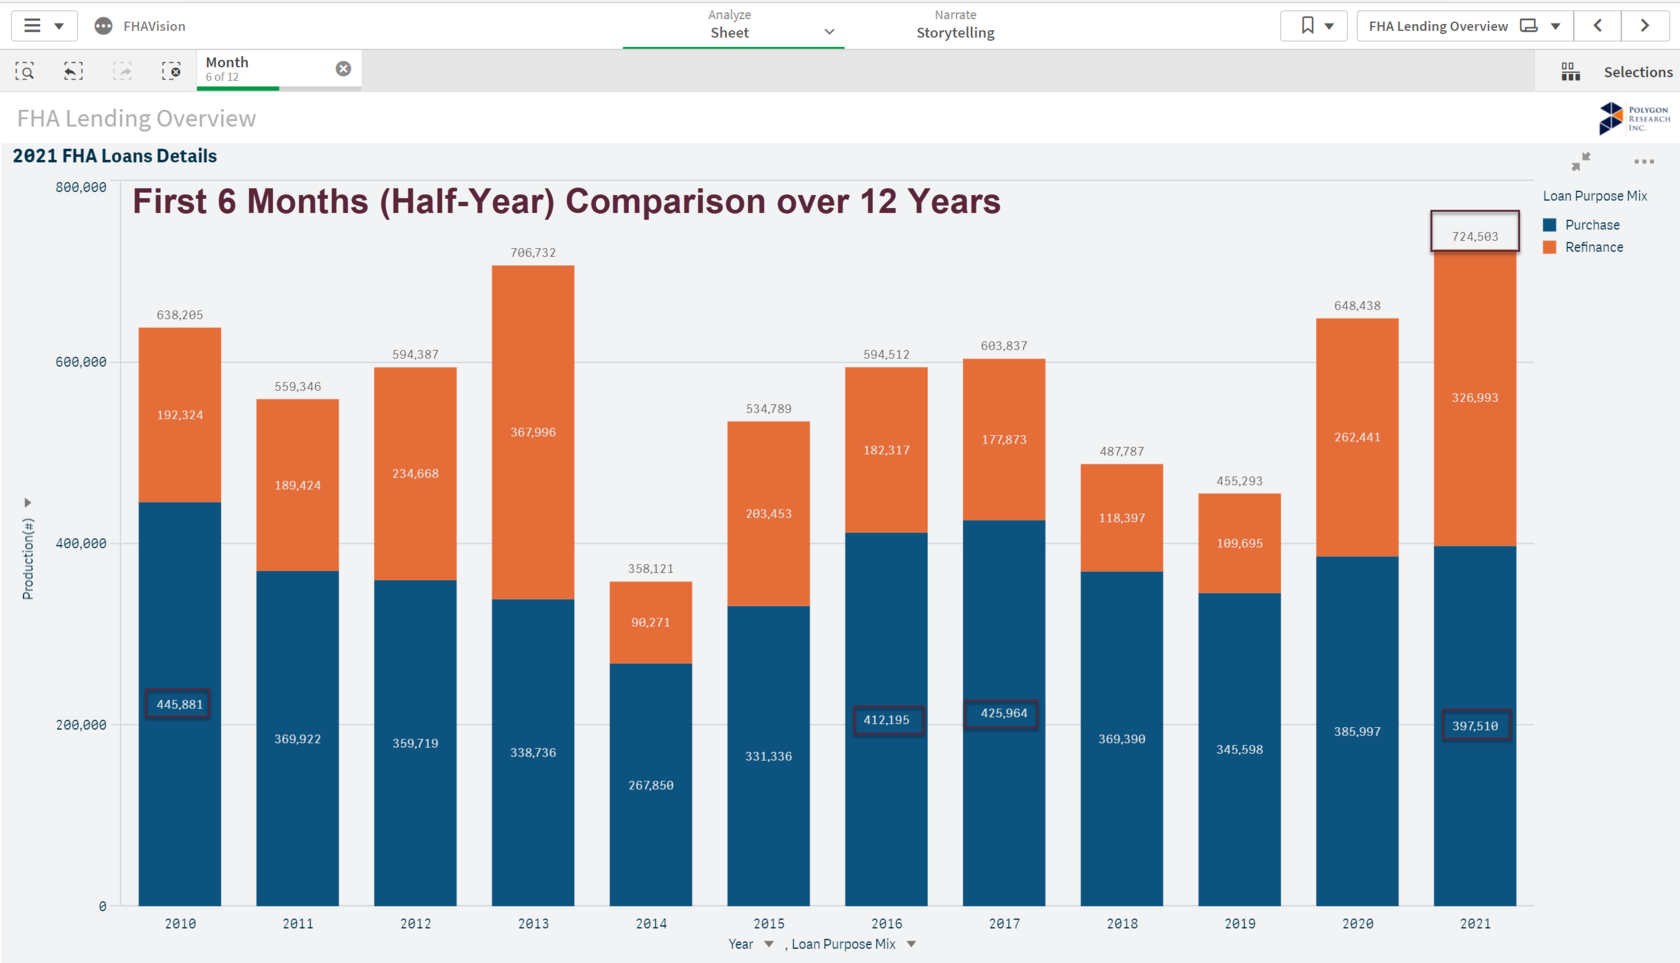
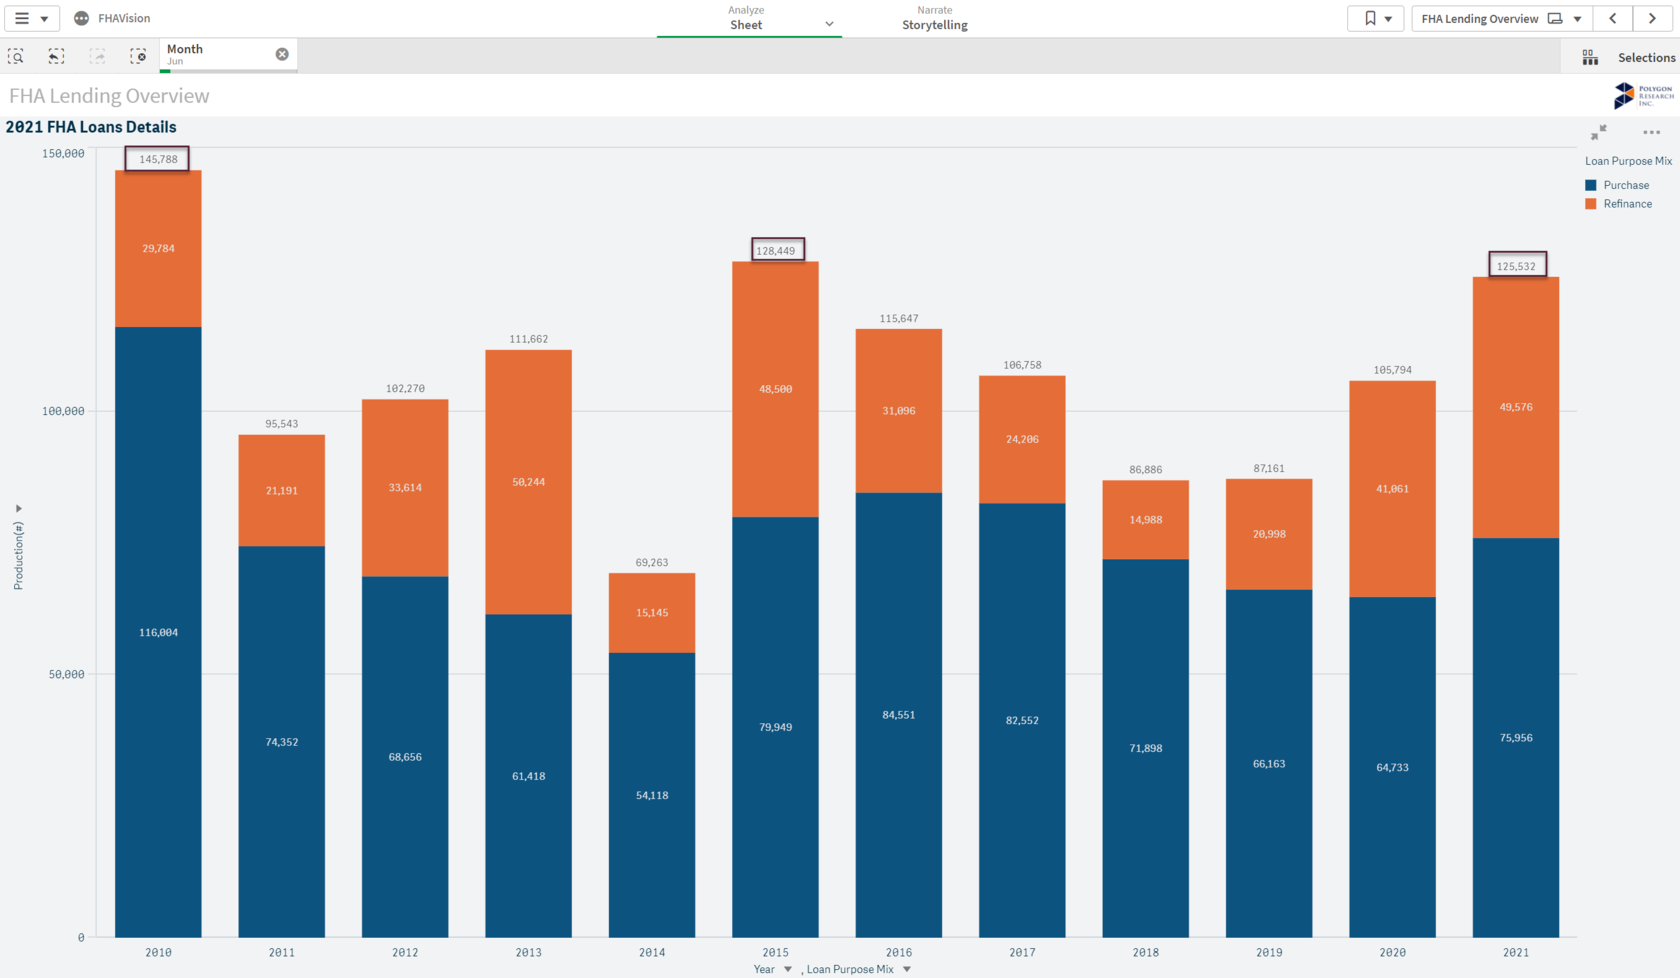
Second, the overall June FHA loan production of 125,532 was the third highest, following June 2010 and June 2015. The weighted interest rates in June 2010 and in June 2015 were 5.05% and 3.84% respectively, much higher than the current weighted interest rate of 3.09% in June 2021.
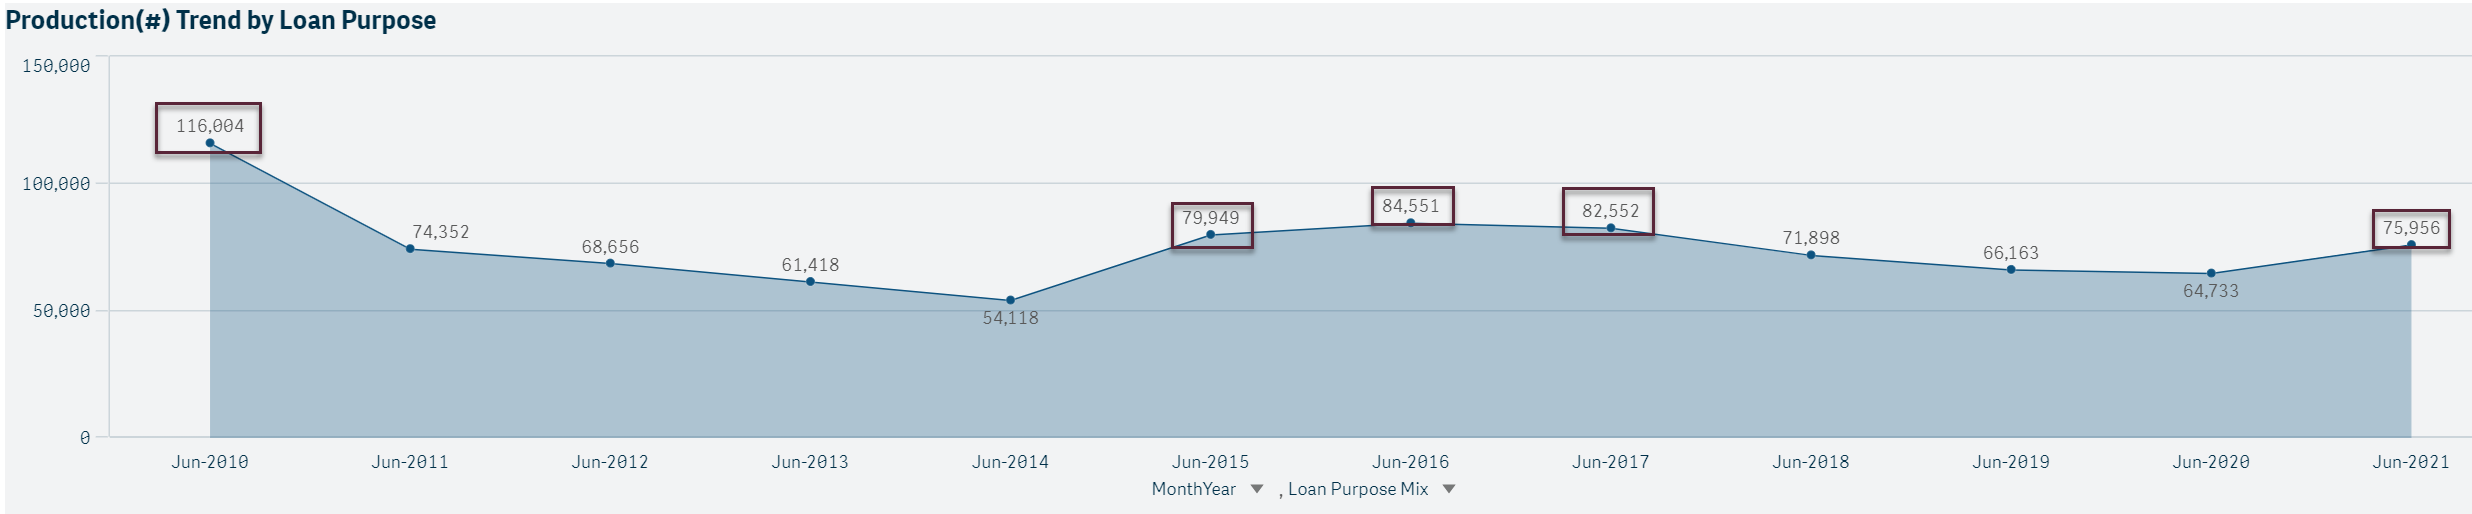
Third, June 2021 was a fairly strong month for purchase mortgage originations. FHA purchase loan production in June 2021 was the fifth highest after June 2010, 2016, 2017, and 2015.
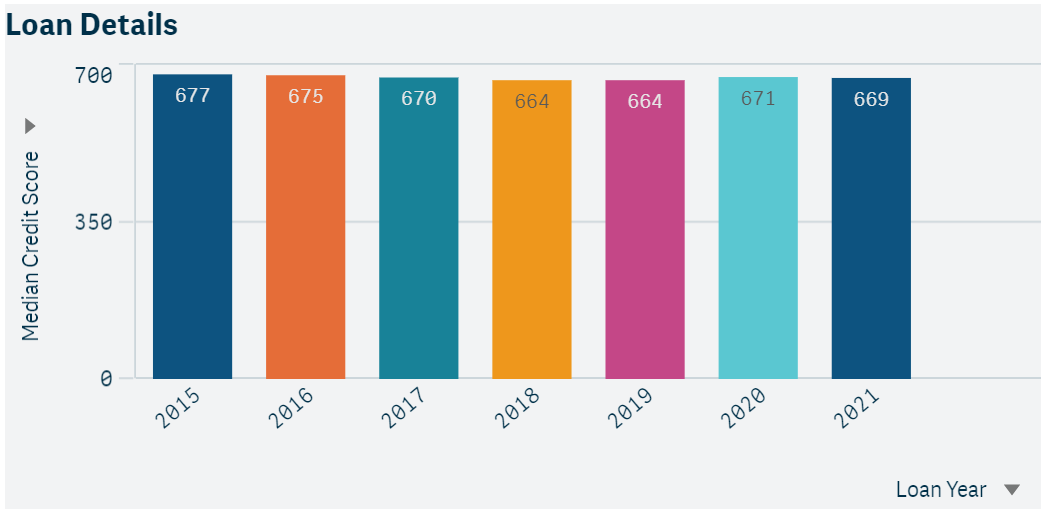
Leveraging our app, GovLoansVision, the median credit score of FHA loans as disclosed by Ginnie Mae, is 669, slightly lower than 2020.
For further insights and exploration, visit Free Resources in our store to download the free June 2021 FHA Infographic, or you can subscribe to FHAVision for 24x7 access. For more information visit: Polygon Research.