Affordability Index for Every Borrower. In Every Neighborhood.
PAI is the first affordability index built on the complete HMDA dataset — every mortgage transaction, every borrower profile, every geography. Score affordability for any segment, any census tract, any year from 2018 to 2024. Inside HMDAVision.
PAI Scores for 50 Largest U.S. Housing Markets (2018 vs. 2024)
This table lists Polygon Affordability Index (PAI) scores for the 50 largest U.S. mortgage markets,
comparing 2018 to 2024 and showing the net change. Higher PAI values indicate greater affordability.
Click a column header to sort, or use search to filter by city or state.
Polygon Affordability Index scores for the 50 largest U.S. housing markets,
comparing 2018 and 2024. A higher score means greater affordability.
The analysis covers fixed-rate, first-lien, closed-end purchase loans for
1–4 family primary residences. Transactions above $100 million in property
value or income are excluded as outliers.
City
2018 PAI
2024 PAI
Change
Cleveland, OH
78
72
-6
Pittsburgh, PA
77
72
-5
Houston, TX
73
70
-3
Detroit, MI
74
69
-4
Oklahoma City, OK
74
69
-5
San Antonio, TX
71
68
-3
Cincinnati, OH
75
68
-7
St. Louis, MO
73
68
-6
Chicago, IL
71
67
-3
Birmingham, AL
71
67
-4
Miami, FL
65
66
+1
Austin, TX
69
66
-3
Indianapolis, IN
73
66
-7
Columbus, OH
73
65
-7
Tampa, FL
68
65
-3
Grand Rapids, MI
70
65
-5
Dallas, TX
69
65
-5
Milwaukee, WI
71
65
-7
Philadelphia, PA
71
65
-6
Kansas City, MO
71
64
-7
Jacksonville, FL
68
64
-3
Orlando, FL
66
63
-2
Minneapolis, MN
67
63
-4
Louisville, KY
70
63
-7
Tucson, AZ
69
63
-6
Baltimore, MD
65
62
-2
Richmond, VA
67
62
-5
Charlotte, NC
68
62
-6
Atlanta, GA
68
62
-6
Raleigh, NC
67
61
-6
New York, NY
62
61
-2
Virginia Beach, VA
65
60
-5
Las Vegas, NV
60
60
0
Charleston, SC
64
59
-5
Sacramento, CA
58
59
+1
Phoenix, AZ
63
58
-5
Washington, DC
59
57
-2
Nashville, TN
62
57
-5
Riverside, CA
57
57
0
Portland, OR
59
56
-2
Providence, RI
64
56
-8
Denver, CO
56
56
0
Boston, MA
60
56
-4
Salt Lake City, UT
55
55
-0.5
Colorado Springs, CO
57
54
-3
Los Angeles, CA
50
54
+4
Boise, ID
61
53
-9
San Diego, CA
50
51
+1
San Francisco, CA
48
51
+3
Seattle, WA
53
47.4
-5
PAI Score (0–100). The analysis includes fixed-rate, first-lien, closed-end purchase loans
for 1–4 family primary residences originated during the study years. Transactions with
reported property values or applicant incomes above $100 million are excluded to remove
potential data-entry outliers.
PAI Score (0–100). Fixed-rate, first-lien, closed-end purchase loans for 1–4 family primary
residences. Transactions above $100M in value or income excluded as outliers.
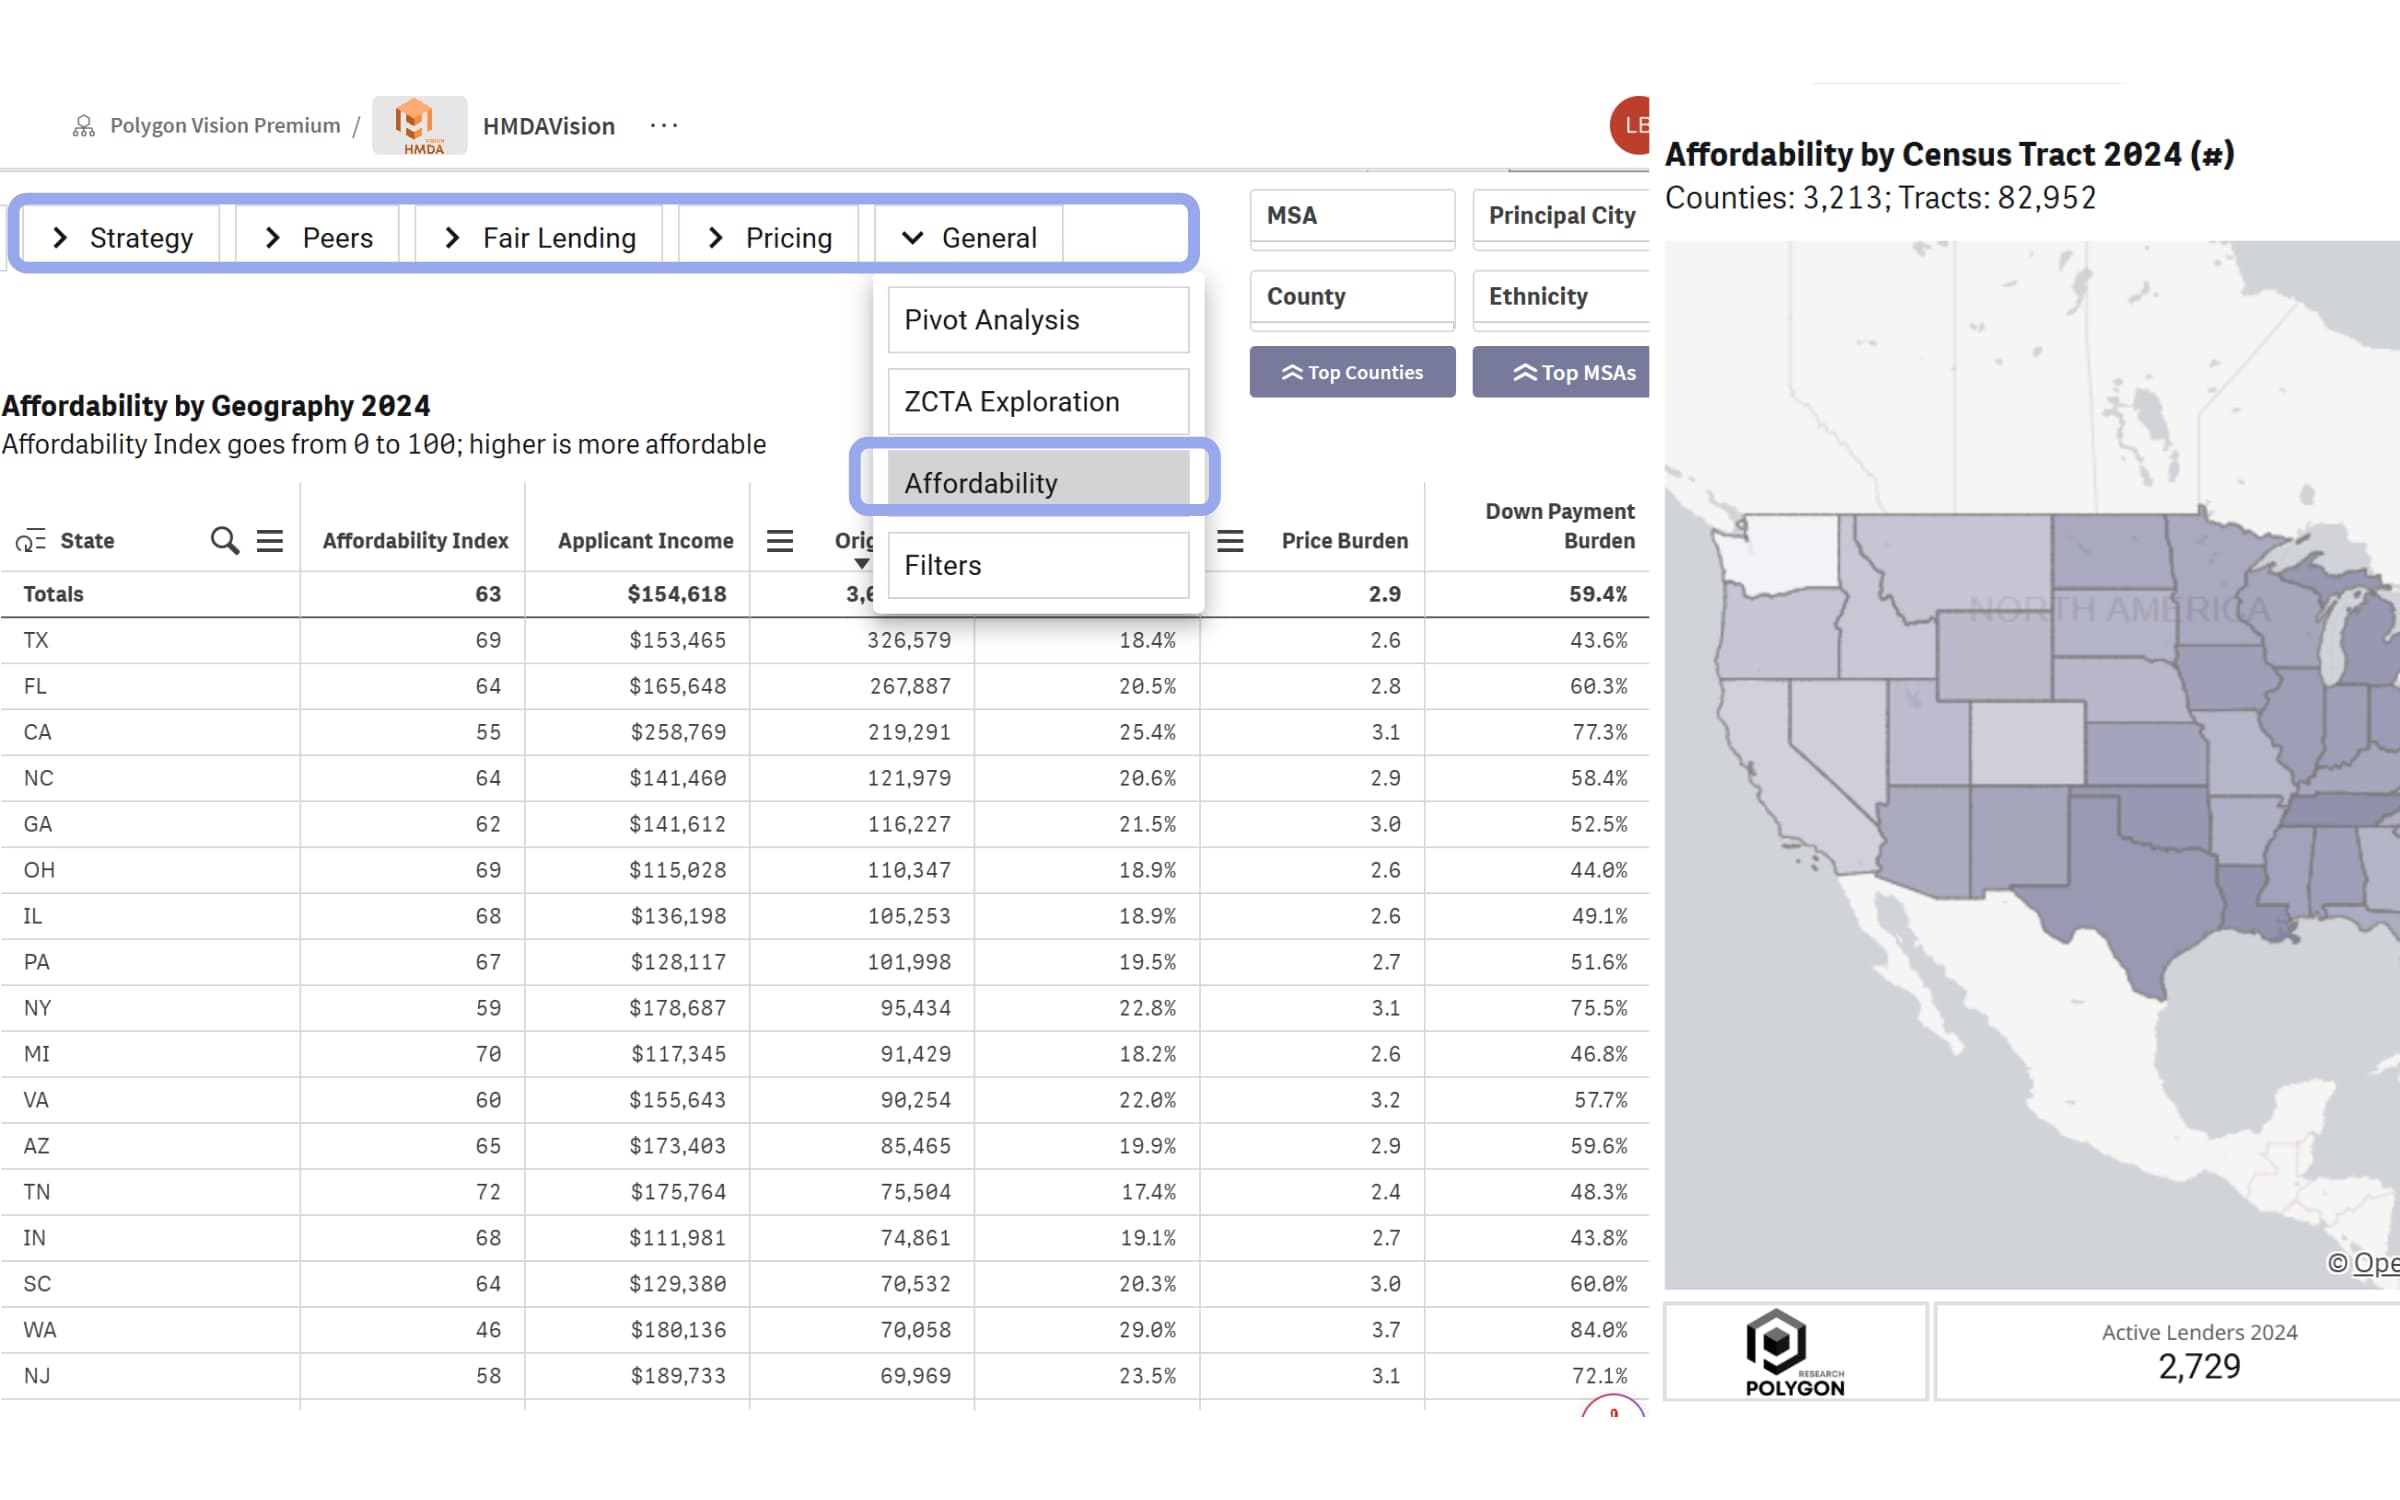
PAI lives inside HMDAVision, Polygon's mortgage market intelligence platform. That means when you see an affordability score deteriorate in a market, you can immediately ask: who is still lending there? At what rates? To whom? No toggling between tools. No reconciling different data sources. One platform, one source of truth — HMDA.
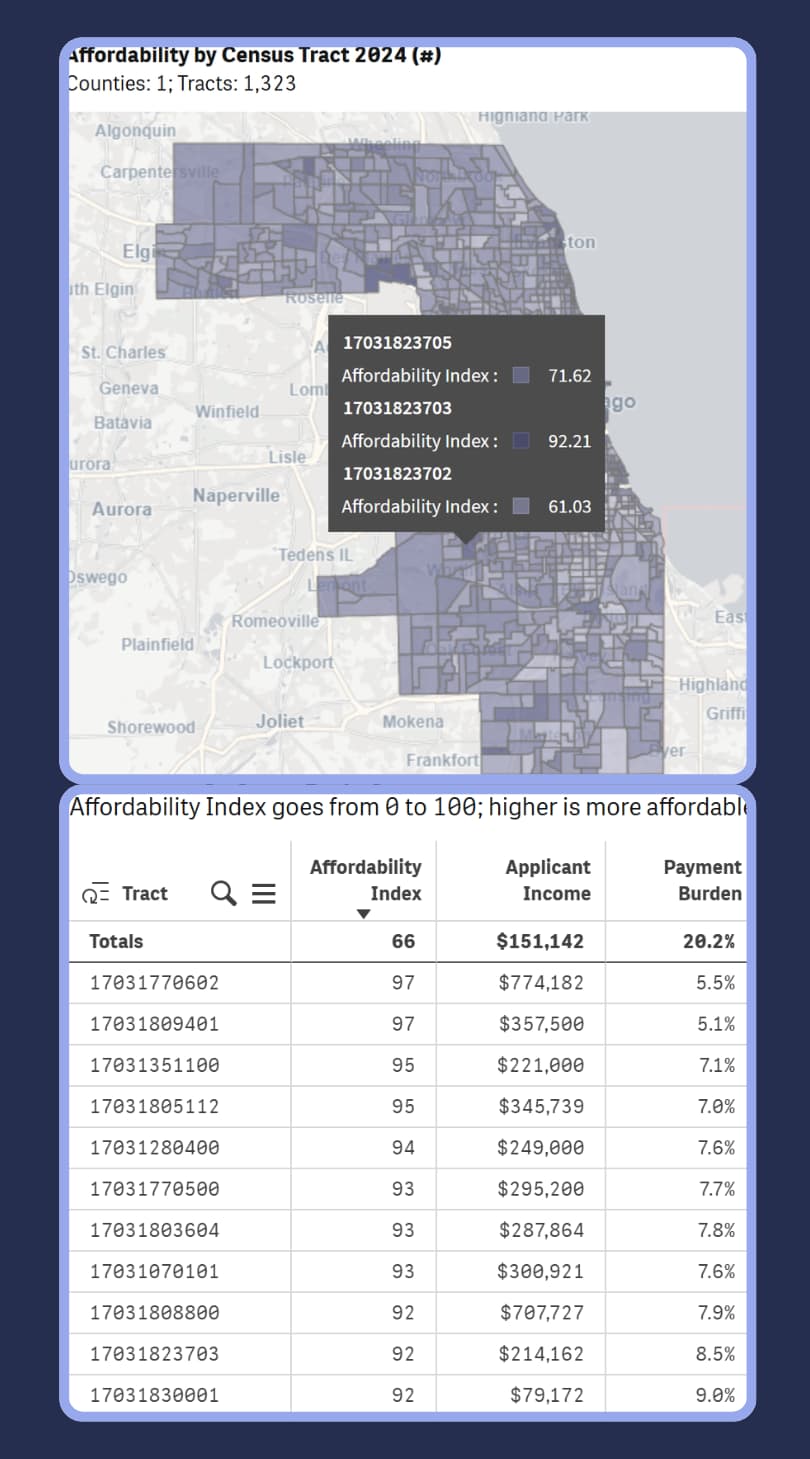
Affordability trends at every geographic level — from national to census tract — since 2018. Document neighborhood change, track market recovery, and build an evidentiary record based on actual HMDA transactions, not survey estimates.
Continuous Mortgage Transactions Data
Multiple years of HMDA data.
83,000+ Census Tracts
The most granular affordability record available.
Affordability by Segment
Every segment by loan type, lender, borrower income, race and ethnicity and more.
Powerful, self-serve product and growth analytics to help you understand affordability at community level. Trusted by NAHREP.
Policy & Government
Track affordability change in underserved communities for legislative and regulatory analysis. PAI gives you census tract-level affordability trends across every congressional district, documented and filterable, ready for a brief, a hearing, or a report.
Research & Consulting
Cite with confidence. Your analysis is as good as your data source. PAI is built on the federal HMDA dataset - the most comprehensive public record of U.S. mortgage activity - modeled by Polygon Research's data science team. Used by think tanks, housing researchers, advisory firms.
Lenders & Credit Unions
HMDA is the foundation for fair lending assessment. PAI is built on HMDA, which means your affordability analysis and compliance speak the same language. Document community need over time. Stress test your lending patterns against actual market conditions.
CDFI & Community Development
Prove community need. Grant applications, impact reports, and investment prioritization all depend on documenting affordability. PAI gives you multiple years of transaction-based evidence at the census tract level. Used by NAHREP to analyze affordability for Hispanic homebuyers across U.S. markets.
The Polygon Affordability Index (PAI) is the first housing affordability index built entirely on HMDA — the Home Mortgage Disclosure Act dataset. Unlike traditional affordability measures that rely on survey estimates and median assumptions, PAI scores affordability using actual mortgage transactions filed by lenders across the United States. The result is a granular, filterable, and historically consistent measure of housing affordability at every geographic level, for every borrower segment, since 2018..
What is the Polygon Affordability Index? How is affordability calculated?
PAI scores each geography 0 to 100 — higher means more affordable. The score is a weighted composite of three burden measures, all drawn from actual HMDA transactions: Payment Burden (50%) — monthly mortgage P&I payment as a percentage of applicant income. Price Burden (30%) — property value relative to annual income, indicating years of income/salary needed to buy. Down Payment Burden (20%) — down payment required as a percentage of annual income, capturing the entry barrier that payment-only measures miss.
To ensure consistency across all geographies and years, PAI applies a standard filter set: purchase loans, fixed rate, closed-end, 1–4 family, originated loans only.
What geographies does PAI cover?
PAI covers every U.S. geography where HMDA data is reported — from national and state level down to MSA, county, zip code, and census tract. That includes majority-minority census tracts (MMCT), majority Black census tracts (MBCT), majority Hispanic census tracts (MHCT), and low-to-moderate income (LMI) geographies. Over 82,000 census tracts are indexed, making PAI the most geographically granular affordability measure available.
How far back does the data go?
PAI tracks affordability continuously since 2018, giving you a multi-year record of how markets have changed at every geographic level. You can document neighborhood deterioration, identify markets recovering from rate shocks, and track long-term affordability trends in any geography or borrower segment — all from a single consistent data source.
How is PAI different from national affordability metrics like the NAR Housing Affordability Index or Harvard's cost burden measures?
Traditional affordability indexes — including NAR, Freddie Mac, and Harvard JCHS measures — are built on survey-estimated income and median home price assumptions. They produce a single number for a broad geography based on what a typical household should theoretically be able to afford. PAI is built on actual HMDA mortgage transactions — real applicant incomes, real loan amounts, real payment obligations. This means PAI reflects what borrowers actually experienced, not a modeled estimate. It also means PAI can be segmented by borrower profile and geography in ways no survey-based index can match.
Is PAI updated regularly?
PAI is updated annually following each HMDA data release. Because HMDA is a federal disclosure requirement, the dataset captures the complete record of mortgage activity for each calendar year. Polygon Research processes and publishes updated PAI scores following each annual HMDA release, ensuring the index reflects the most recent complete year of mortgage market activity.
How do I access PAI?
PAI is a sheet inside HMDAVision, Polygon Research's mortgage market intelligence platform. This means affordability data is always in context — alongside origination volume, lender peer comparisons, pricing analysis, and fair lending data, all from the same HMDA source. You can start a free trial of HMDAVision to explore PAI across all geographies and borrower segments, with no credit card required.
Start your 7-day free trial
No installation. No fees. Cancel anytime within the free trial period.