Wildfires, Mortgage, and the Role of Open Data
.jpg)

As the January 2025 wildfires rage through Los Angeles County, they illuminate a critical yet often overlooked dimension of natural disasters: their profound impact on financial markets, particularly in the mortgage lending sector. The immediate focus of course falls on the human and physical devastation - with 283 active fires claiming 28 lives and destroying 16,240 structures according to the official website for CAL FIRE).
The ripple effects through local housing markets, borrower stability, and lender portfolios, however, also require urgent attention.
Our analysis of FEMA's National Risk Indicator (NRI) data reveals a sobering reality. In Los Angeles County, wildfire hazard risk ranks second only to earthquakes, with an Estimated Annual Loss (EAL) of $108.6 million.
California Governor Gavin Newsom’s mortgage relief measures were announced on January 23, 2025. These measures specified 13 zip codes in Los Angeles County that will receive the relief committed by about 300 lenders, banks, and credit unions. The commitments by these financial institutions include:
- 90-Day Forbearance - pausing payments without extensive documentation.
- Flexible Repayment Options - deferring payments without immediate repayment demands.
- Fee Waivers and Credit Protections - deferred payments won’t affect credit scores.
- Foreclosure and Eviction Moratorium - a 60-day hold to prevent displacement.
The Data for Wildfires and Mortgage Lending
To truly understand what's at stake, we turned to the Home Mortgage Disclosure Act (HMDA) data, the most comprehensive dataset available for analyzing mortgage lending patterns. On the Polygon Research platform we've integrated HMDA with data from FEMA's National Risk Index for Natural Hazards (NRI) and the Census Bureau to enable a granular analysis that goes beyond traditional lending assessments. We do this at scale - complete microdata over multiple years - to allow stakeholders to both quickly understand the lay of the land and make strategic decisions to reduce risk and to grow the business. Since HMDA and FEMA data are published at the census tract level, we crosswalk tracts to zip code tabulation areas (ZCTA), and in the following discussion use ZCTA and zip code interchangeably.
Mortgage originations from 2023 in the 13 designated ZIP codes provide critical insights. While they represent just a slice of lenders' broader portfolios, these originations quantify the exposure to new borrowers (12-24 months loan age). New borrowers often have less equity in the home, making them more susceptible to shocks. In addition, mortgage originations allow us to analyze the loan characteristics of recent loans. Riskier loan types, such as high combined loan-to-value (CLTV) loans or adjustable-rate mortgages (ARMs), can exacerbate default risks. The intersection of borrower needs, housing stock, and lender activity shows how specific communities are affected by disasters.
First, let's review mortgage lending for the 13 zip codes (90019, 90041, 90049, 90066, 90265, 90272, 90290, 90402, 91001, 91104, 91106, 91107, 93536), using the most recent HMDA data in HMDAVision, where we can capture multiple insights in a single dashboard, as shown in Chart 1 below.
Chart 1: Mortgage Originations and Loan Characteristics Across Designated ZIP Codes
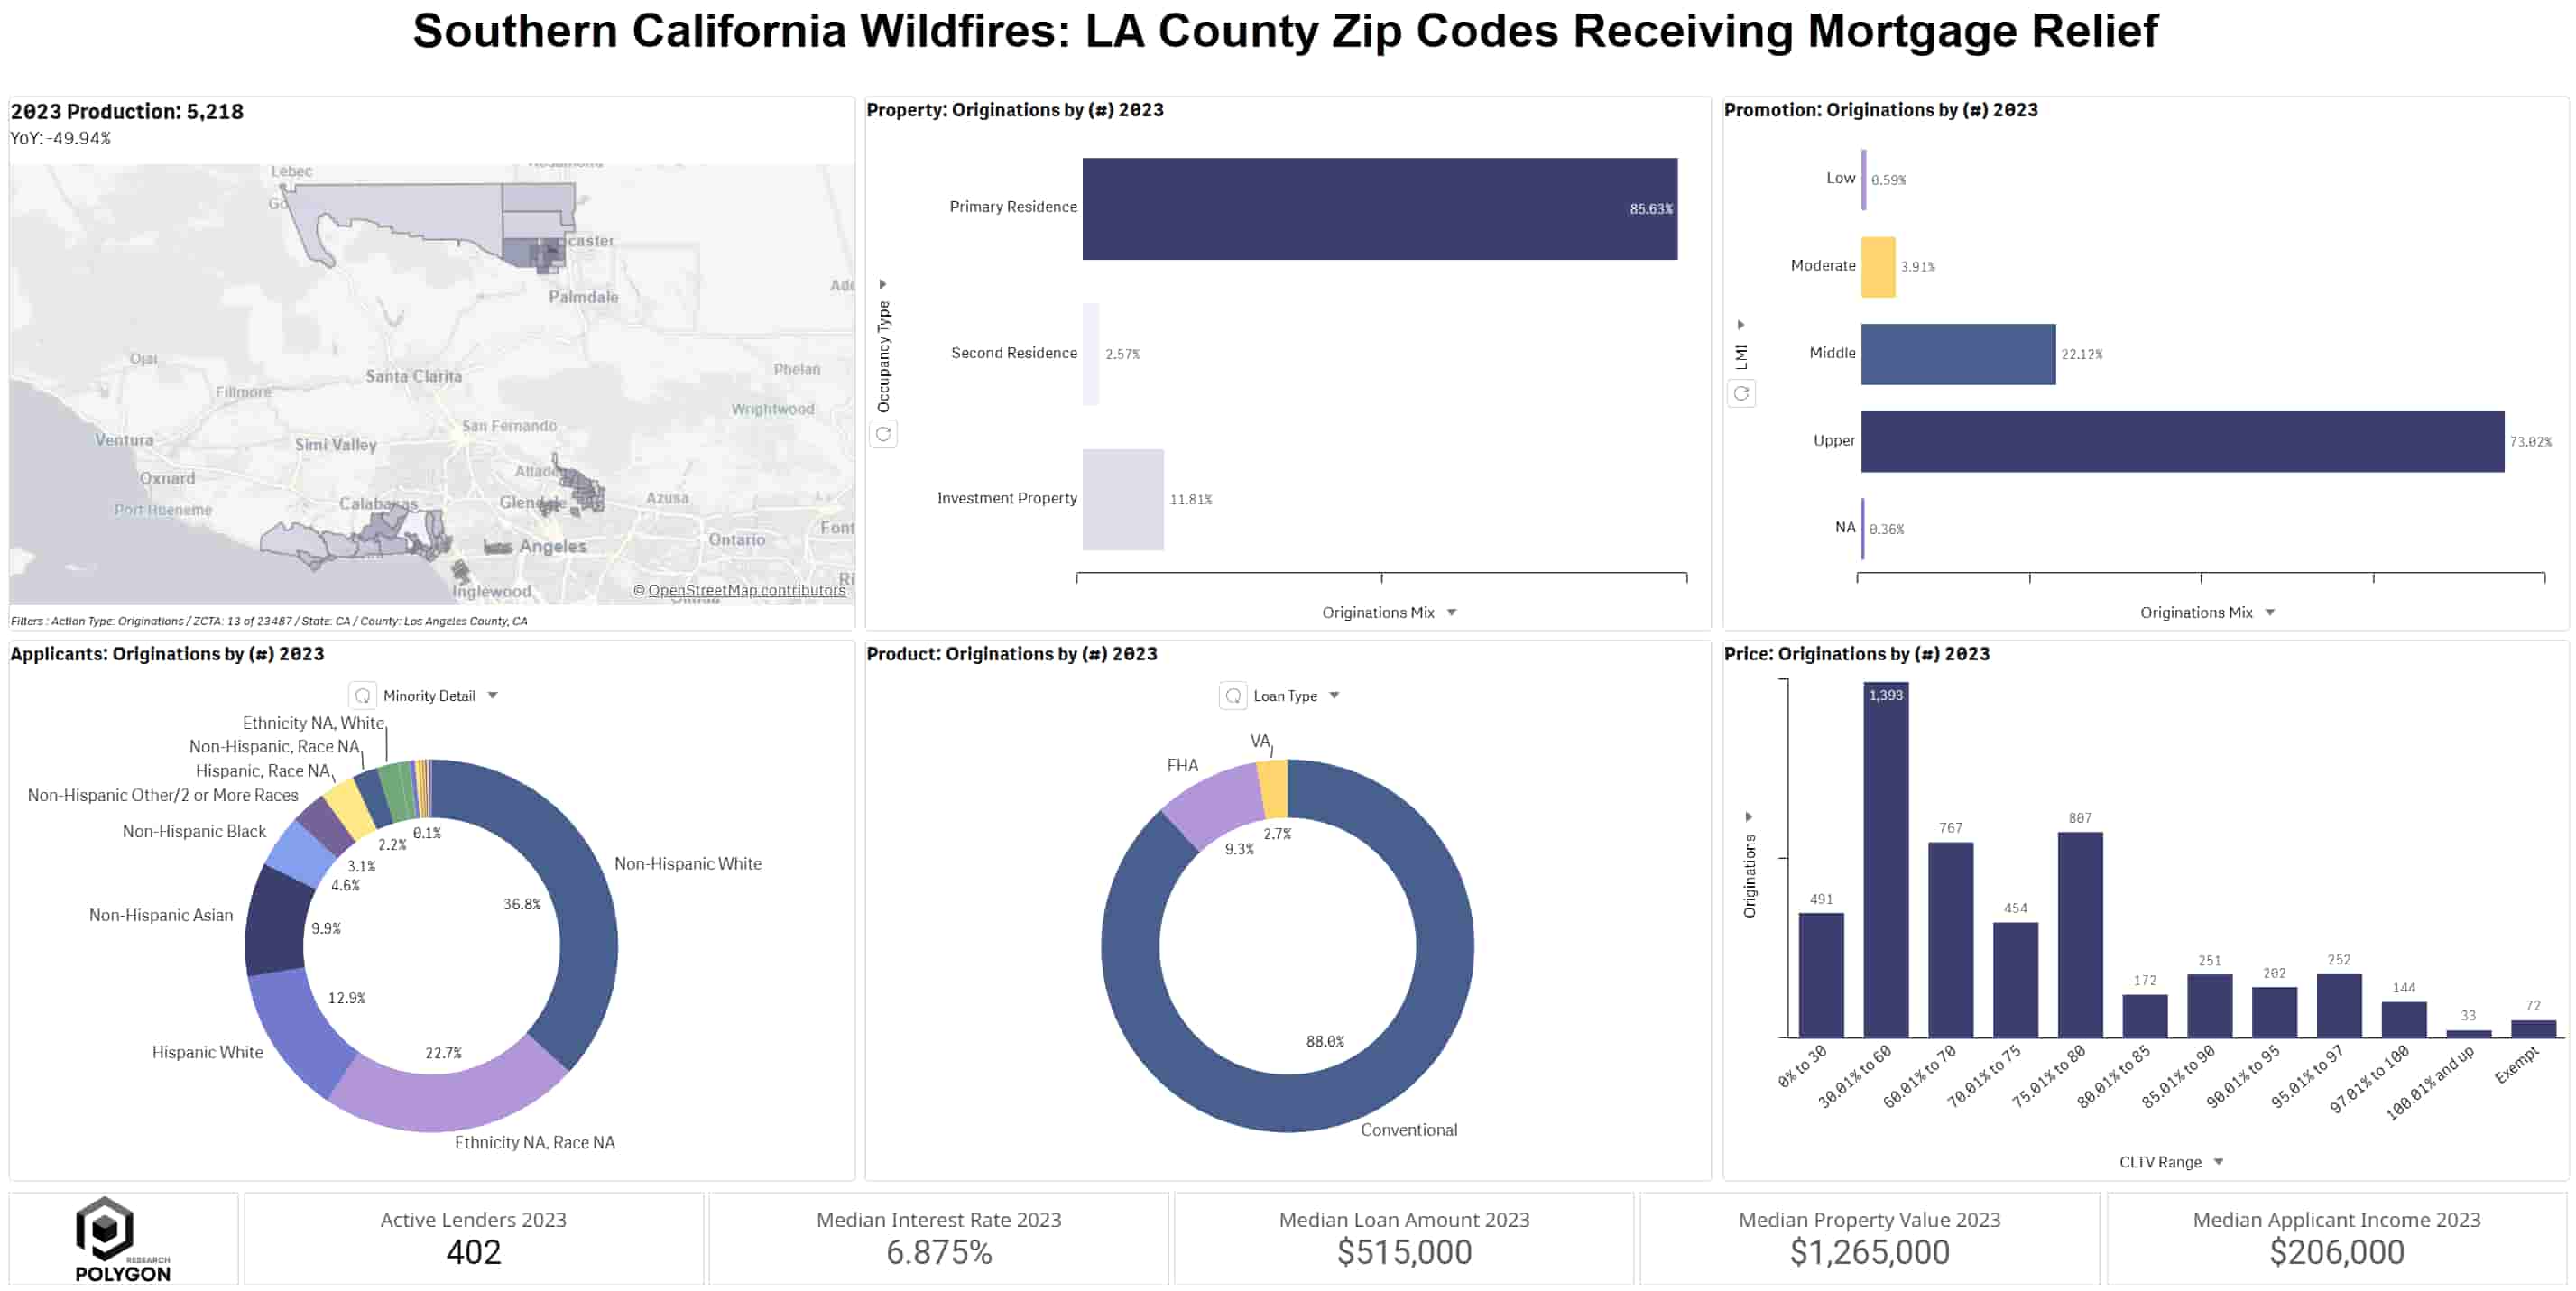
Geographic and Financial Patterns Emerge
Next, Chart 2 shows the relief-eligible zip codes with the number of loans originated in each along with 3 loan size quantiles - 10, 50 (median), and 90.
Chart 2: Mortgage Lending by Designated Zip Code in Los Angeles County

Our analysis reveals distinct clustering patterns in loan sizes across affected areas.
Lower-Cost Markets
Lancaster (93536) leads in loan production with 1,459 loans, yet maintains the lowest median loan size at $405,000. Altadena/Pasadena Area (91001, 91104, 91106) shows slightly higher but consistent median loan sizes ranging from $435,000 to $535,000.
High-Cost Markets
- 90265, 90402 (Malibu, Santa Monica) with median loan amount around $1.5M
- 90049, 90272 (Brentwood, Pacific Palisades) have a just slightly lower median loan amount between $1-1.1M.
Lender Activity and Risk Exposure
The lending landscape across these affected zones reveals fascinating patterns in market participation and risk appetite.
Independent lenders account for 44% of loans in the identified 13 zip codes for relief. In contrast, credit unions tend to originate more subordinate lien (seconds) loans and those often have smaller loan sizes and lower CLTVs. Banks, on the other hand, tend to be more prominently placed in high-value properties in zip codes like 90265 (Malibu).
Chart 3 plots the loans originated by lender type showing applicant income on the x-axis and CLTV on the y-axis.
Chart 3: Lending Landscape by Lender Type

As we can see, each lender type has a variety of lending models which require tailored risk strategies. Banks target higher-income borrowers (around $400K) with lower combined loan-to-value (CLTV) ratios, suggesting more conservative lending practices and a focus on prime borrowers. Independent lenders serve middle-income borrowers ($150K) with higher CLTVs (~75%) which gives them a broader market reach. Credit unions operate in similar income ranges as independents but with lower CLTVs (~55%), reflecting their member-focused, risk-balanced approach. MBS bank holding companies and depository affiliates target moderate-income borrowers ($150-250K) with higher CLTVs (~80%), focusing on conforming loans for securitization. Independent lenders dominate loan production in these zip codes, as indicated by the size of the bubble.
Focus on Zip Code 93536 Lancaster, California
Zip code 93536 (Lancaster) demands special attention. First of all, the Expected Annual Loss (EAL) associated with wildfires is about $2.2 Million. Second, it accounts for 28% of all loans in the affected area defined by the 13 zip codes. This concentration of lending activity, combined with a median CLTV of 85%, signals potentially heightened vulnerability in the face of natural disasters. The high CLTV ratio indicates less borrower equity. This metric is important because less equity could complicate recovery efforts and increase default risks if property values decline due to wildfire damage.
Chart 4: Mortgage Lending and Wildfire Risk

Building Resilience
The analysis of these 13 Los Angeles County zip codes reveals not just immediate vulnerabilities but also opportunities for more proactive risk management. While some forward-thinking lenders are already adopting sophisticated approaches that could have mitigated some of the current crisis's impact, there's still much work to be done in transforming how the industry approaches natural hazard risk.
Our deep dive into lending patterns across these affected areas has shown that accessible, transparent tools can provide equally valuable insights as complex risk models from major providers. Through our analysis using HMDAVision and TerraVision, we've seen how lenders can gain actionable insights without drowning in complexity. The visualization of lending patterns across the affected zip codes helped identify concentration risks that might have otherwise gone unnoticed, while TerraVision's transparent hazard risk metrics illuminated risk patterns that demanded attention, particularly in zip code 93536 where high loan concentration coincides with significant wildfire exposure.
The Los Angeles case study points to several crucial adaptations lenders should consider. Risk-based lending parameters need to evolve, with careful attention to LTV requirements and insurance coverage in vulnerable regions. The high concentration of lending in certain zip codes suggests that portfolio management strategies need refinement, with regular monitoring becoming increasingly critical as climate risks intensify.
Perhaps most importantly, the concentration of lending in zip code 93536 highlights how crucial community-level engagement has become in risk mitigation. Lenders are uniquely positioned to play a vital role in building resilience through local education and incentive programs. By partnering with Los Angeles County fire departments for community workshops and creating targeted education about local wildfire risks, lenders can help communities better prepare for and respond to natural hazards. Moreover, offering specialized loan products for fire-resistant home improvements and partnering with local contractors for approved mitigation measures creates tangible paths to reducing risk.
The path to better hazard risk integration doesn't require a complete overhaul of existing systems. Instead, it calls for thoughtful integration of readily available data and tools. FEMA NRI data, when combined with intuitive platforms like HMDAVision and TerraVision, provides a solid foundation for regular portfolio analysis. Building relationships with emergency services in high-risk zip codes and partnering with community organizations for education and outreach creates a network of support that strengthens overall resilience.
Looking Forward
The January 2025 Los Angeles wildfires have made it abundantly clear that waiting until after disasters strike is no longer sustainable. Our analysis of the 13 affected zip codes paints a picture of both vulnerability and opportunity. The mortgage industry must evolve beyond its traditional reactive approach to natural hazard risk and embrace a more proactive stance that combines practical data tools with meaningful community engagement.
The lessons from Los Angeles County provide valuable insights for lenders nationwide. Lenders should invest in accessible data tools. Lenders should foster community education programs around options to make homes more disaster resilient and they should create practical incentives for hazard mitigation. This kind of engagement offers better protection for both their portfolios and their communities. The path forward requires a delicate balance of risk management and community support, but the rewards – more resilient portfolios and better-protected communities – make this transformation essential for the future of mortgage lending in an increasingly uncertain climate.